One of the challenges that modern IT businesses face, is the regulation of communications between a service provider and a client. This regulation is often called Service Level Agreement. In the API world specifically, SLAs can also be used as a measure to establish Service Level Objectives (SLO), when APIs must be constantly checked against operational and/or contractual metrics.
An SLA describes the acceptable level of service availability and performance to a customer, provider or both. An array of possible API metrics includes, but is not limited to:
Where is this data captured and how is it monitored?

It is captured by the API Gateway, the specialized API proxy that intercepts API calls. Pretty much every API Management vendor today offers this with API Monitoring capability. Among all the other tasks that API Gateways execute, one of their main objective is to record API Monitoring data while intercepting messages and forwarding / receiving them to and from the actual backend APIs/Services.
Let’s consider a requirement of when a service provider wants to monitor the usage of their services measured in number of API requests. Let’s say, that the provider also wants to receive alerts, when a specified threshold of that usage is surpassed, for example, 10 requests per minute.
Here is a demonstration of how Sentinet API Management can solve this requirement and provide all useful information with a minimal effort.
Sentinet Service Agreements can be created to define API usage measurements that must be captured. To create a new Service Agreement, a user should do the following:
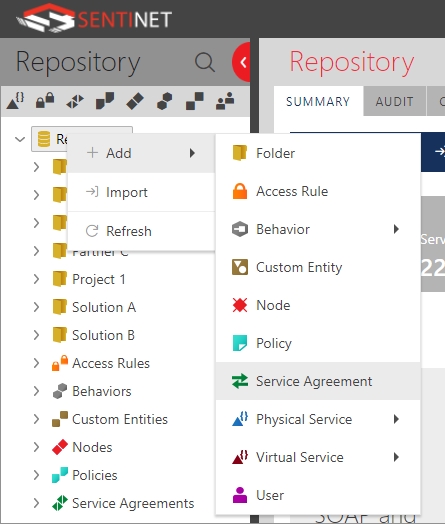
Right click Repository and proceed to Add > Service Agreement.
Type an SLA friendly name in the Name field.
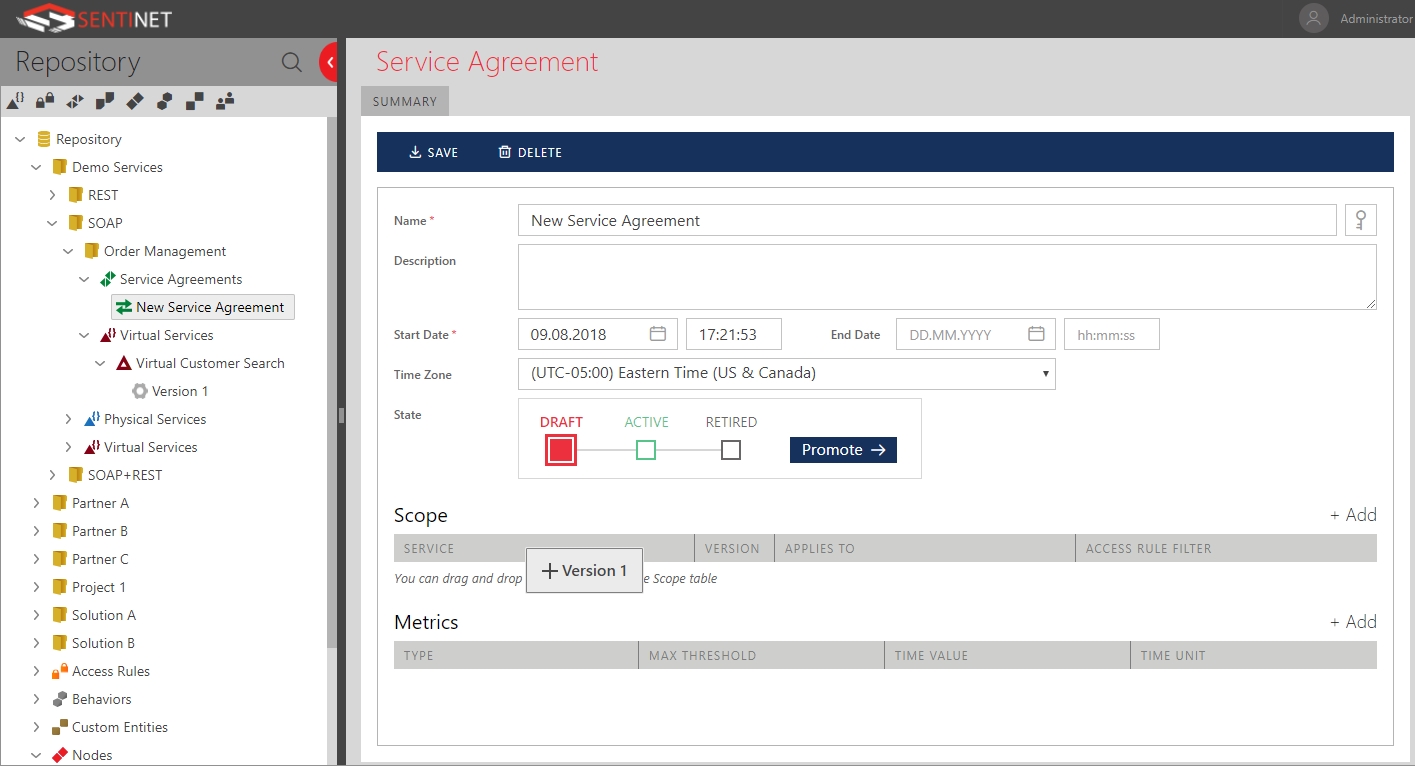
Define a Start Date. The Start Date can be specified in such a way, that the actual monitoring of a particular Service Agreement can be delayed, otherwise use the default value.
End Date is not required. If not specified, the Service Agreement will continue to be monitored until this SLA is terminated (Retired). The End Date can be used to schedule a Service Agreement termination.
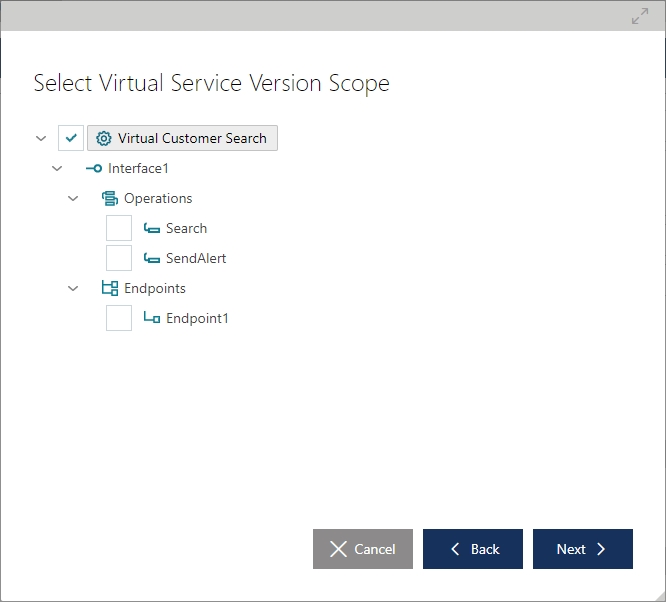
Fill the Scope table. It includes the services to which this new Service Agreement will be applied. A service (or more than one service) can be added using drag and drop. Scope setup allows users to specify which parts of a service the SLA will be applied to; default option is the whole service.
Choose the Metrics. A metric defines an acceptable range value for a specific parameter over a period of time. In accordance to our business scenario described at the beginning of the article, we would like to monitor the total number of API requests and consider it an SLA violation when this number exceeds 10 per minute. After clicking on the green plus sign near the Time Unit field, we begin the customization of our metrics. We choose Total Count metric, set Max Threshold to 10, Time Value to 1 and Time Unit to Minute. This is what it looks like in the Sentinet Console:

To activate the new Service Agreement, we promote its status to Active. To simulate a violation, we will send more than 10 requests during a 1 minute time interval.
After that, we click the Violations tab to check the real-time Violations graph.
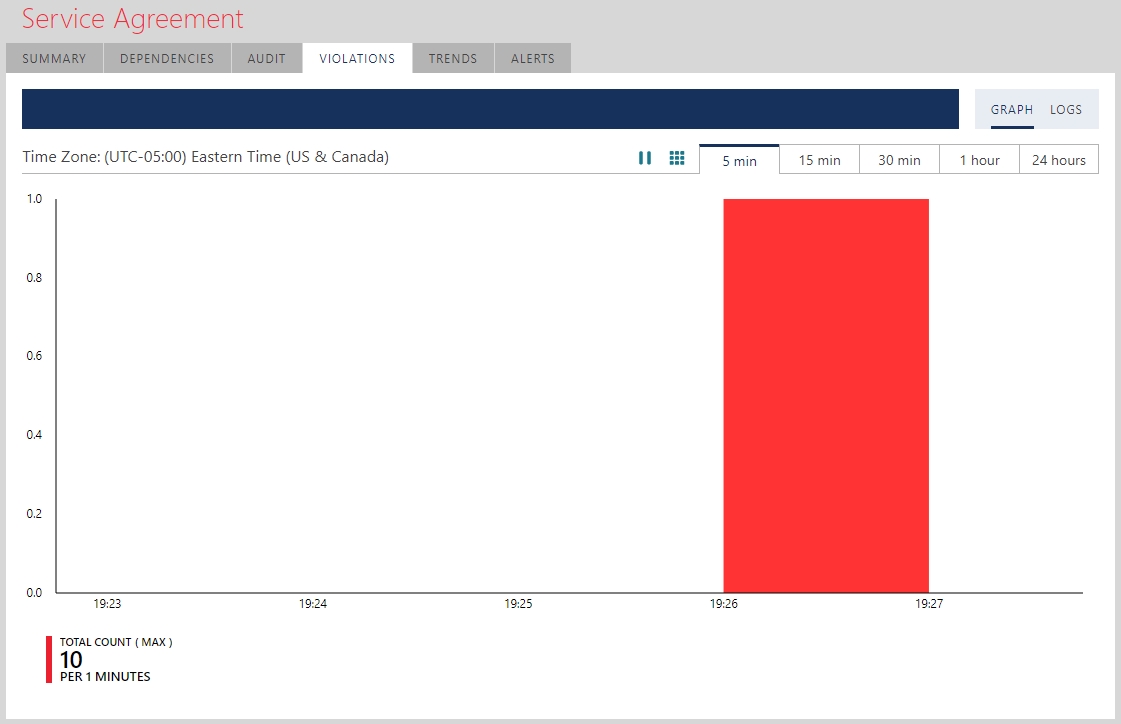
The violation is recorded and shown with the (previously defined) SLA metric at the bottom of the graph in the Metrics table. The graph shows 1 violation during one minute from 19:26 to 19:27.
Another way to monitor SLA violations, is the violations Logs. Logs present violation statistics in a form of a journal, and can be used as an alternative to the real-time graph, depending on the target usage. It is also worth mentioning, that Logs provide the functionality to search violations historically by different time periods. Let’s send few more requests and check how they are depicted in the Logs journal:
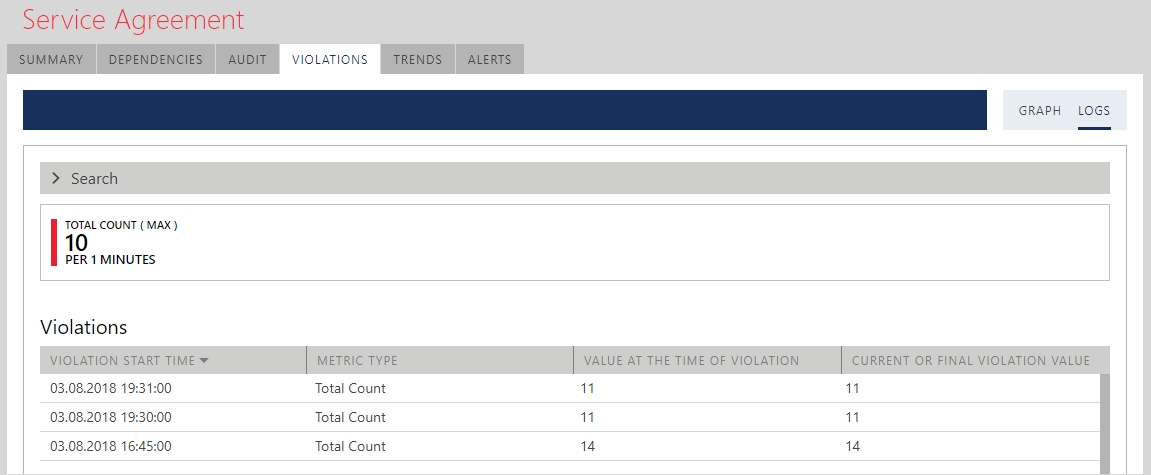
The journal above shows more violations occurring during three different 1-minute time intervals. Please regard the fields Value at the time of Violation and Current or final Violation Value, which happen to have the same values in this screenshot. This is not always the case. To demonstrate the difference between Value at the time of Violation and Current or final Violation Value, let’s create another Service Agreement, with the same Max Threshold of 10 but with the Time Value increased to 2. Now we will send 39 requests in 2 minutes:
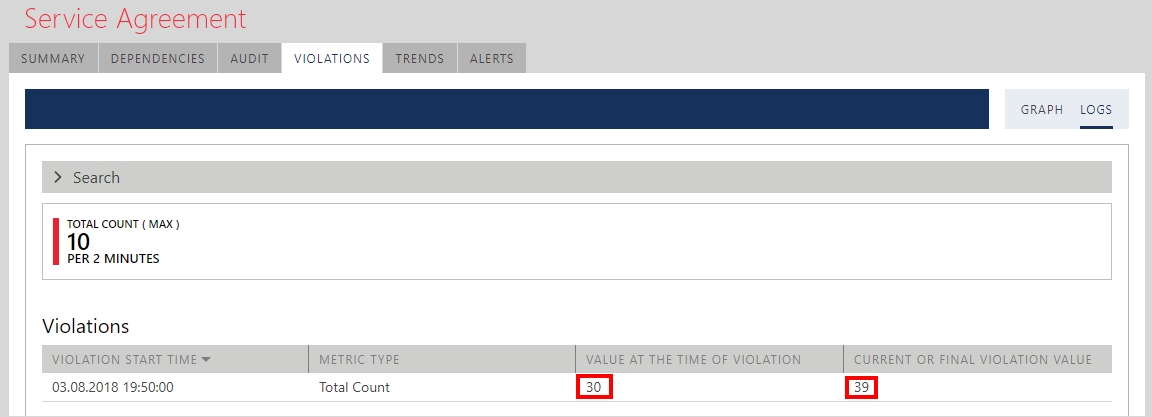
Value at the time of Violation and Current or final Violation Value values are different this time, they are 30 and 39 on the screenshot above. A Violation is generated as soon as the metric exceeds its threshold. However, the metric is computed over a time period, so that when the time period actually ends, the value can be different (in this case it is even worse (39) than at the time the violation was identified).
In this article, we solved the business task of monitoring SLAs for APIs. We selected the API usage metric measured in the number of transactions per minute, and observed SLA violations with the help of a real-time Violations Graph and the historical Violations Logs journal. The importance of SLAs is apparent in today’s IT landscape and there are more ways to setup and monitor these agreements with Sentinet API Management. More on this topic is to come in the next part(s) of this article...