Recording
Sentinet provides powerful and flexible message body recording options. While flying through a Sentinet Node, a message's content can be captured at different stages of processing. For example, a request message can be recorded exactly as it comes off the wire (possibly encrypted) and then recorded again once it is decoded and decrypted. Whether these example recordings produce the same or different results, depends on the transport, encoder and other policies assigned to a monitored endpoint.
The delivery of Sentinet monitoring data is isolated (decoupled) from business transactions, it is delivered to the Repository Web Services Application asynchronously in respect to the actual business transactions. This is done to allow business transactions to be processed as fast as possible and not to slow them down just to deliver Sentinet monitoring data.
To achieve that, a Sentinet Node uses internal in-memory queues to store a limited number of queued monitoring data records. If this queue is unloaded as fast as business transactions fly though, then its size is fixed and negligible. But if business transactions are small and fly through very fast, then the in-memory queue may start growing. In a typical production environment, loads are not evenly distributed over time. This means that the queue that grows at some peak times will be unloaded during slow times, which enables delivery with load-leveling. This is an architectural messaging pattern that provides benefits of queuing technologies like MSMQ or Microsoft Azure Service Bus.
Under steady and long-running high loads, it is conceivable that the in-memory queue will grow constantly. This might create a negative impact on the whole server machine if the queue size is not controlled. Sentinet provides this control and introduces a few in-memory queue control parameters. Most notable are maxUndeliveredRecords count, and minAvailableMemory in bytes. First parameter controls queue from its absolute size perspective and second parameter controls queue from the perspective of the remaining server memory. If any of these events happen (queue is too large or available server memory drops below configured threshold), then a Sentinet Node stops accumulating monitoring data in the queue and will discard new monitoring data coming to the queue until actual queue size decreases or available memory increases (this process may happen quickly under steady high load). A Sentinet Node may drop monitoring data, but not the business transactions.
Threshold values are defined in Node web.config file and can be changed. The snippet below shows default web.config threshold values:
<nevatech.vsb.runtime>
  <monitoring deliveryPeriod="5" accumulationPeriod="5"
      maxRecordedMessageSize="262144" maxUndeliveredTransactions="0"
      maxUndeliveredRecords="10000" maxUndeliveredActivities="0"
      minAvailableMemory="262144000" maxBatchSize="1048576"
      maxBatchAge="1200" retryInterval="0">
…
Attribute retryInterval configures Sentinet Nodes retries of the monitoring data delivery in case connection with the Repository Web Services Application is lost. Default configured value is "0" which means no retries will be done. Non-zero value defines time in seconds for the retry attempt.
Monitoring and Recording Control
Sentinet monitoring options are controlled graphically through the Monitoring CONTROL tab. Only virtual services have a Monitoring CONTROL tab, because Sentinet Nodes can record messages only at virtual service inbound and outbound endpoints.

Sentinet Monitoring CONTROL tab offers two sub-tabs, RECORDING and FILTERS.
RECORDING sub-tab provides graphical configuration of the recording points where Sentinet will intercept and record messages and their payloads. FILTERS sub-tab provides optional XML configuration that allows Sentinet to filter (modify) messages content before they are recorded.
Important
Filtering recorded messages affects only the content recorded by the Sentinet. It does not affect the actual messages’ content that is transferred between API client and a physical service (API). If modifying the actual content is required, it can be done in the Sentinet graphical Pipeline Processing configuration.
Filtering is typically used to mask security sensitive data to avoid its recording in the Sentinet Repository.
Recording Control
Monitoring options are controlled per each inbound and outbound endpoint of the virtual service when RECORDING sub-tab is selected. The Monitoring Control user interface shows all virtual service endpoints with their respective monitoring options and recording points.
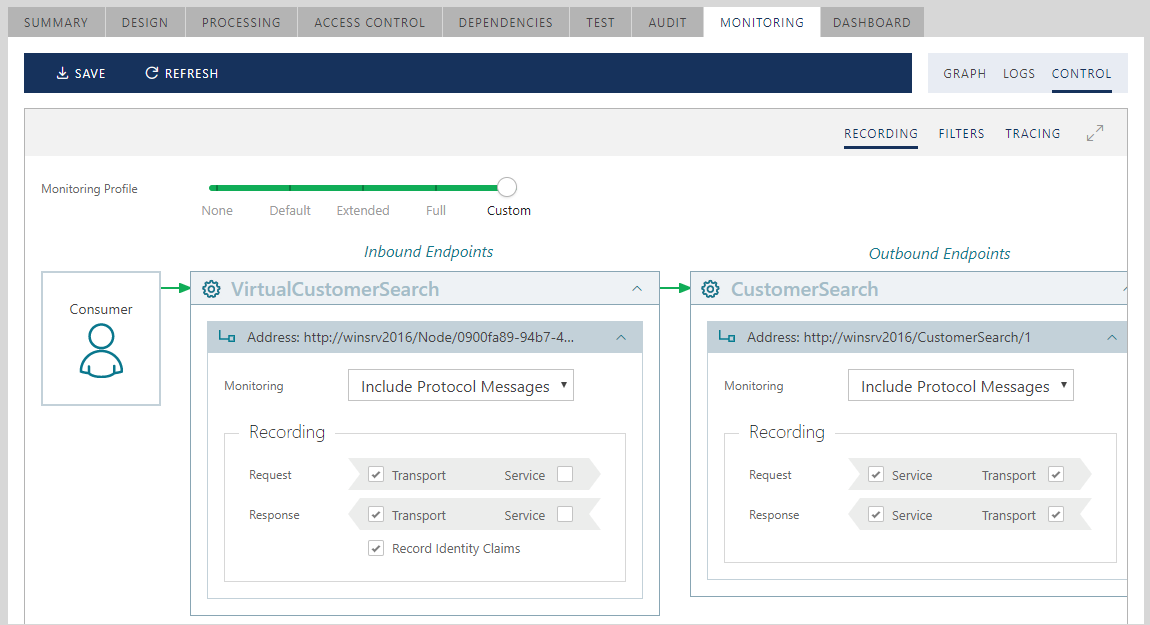
Each endpoint (inbound and outbound) has the following monitoring options:
Off. When monitoring is set to Off, no monitoring data will be collected and delivered to the Sentinet Repository for the endpoint. Note: Sentinet Nodes will still enforce and apply appropriate security, mediations and runtime access control to all business transactions.
Ignore Protocol Messages (default setting). This option instructs Sentinet Nodes to ignore possible protocol handshake messages (such as establishment of a secure conversation and security tokens negotiation message exchanges).
Include Protocol Messages. This option instructs Sentinet Nodes to include in its monitoring all possible protocol handshake messages (such as establishment of a secure conversation and security tokens negotiation message exchanges).
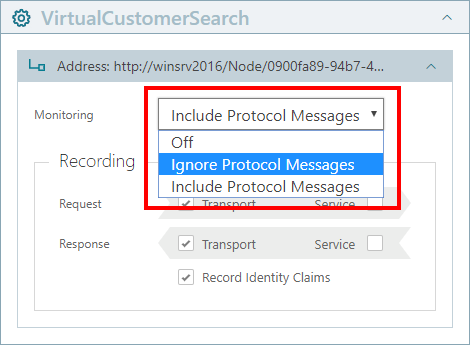
Figure. Monitoring options dropdown list
Each endpoint can be enabled with up to four message recording points (four checkboxes). These are two recording points per Request and two recording points per Response. Recording points in each pair are called Transport and Service recording points, where the first one records messages closer to the wire (Transport point) and the second point records messages closer to the inner point of the virtual service implementation (Service point). As explained earlier in this chapter, Service recording points at matching inbound and outbound endpoints may produce different results if a message undergoes transformations while being delivered from the virtual service inbound side to its outbound side (for example, inbound SOAP 1.1 to outbound SOAP 1.2 transformation).
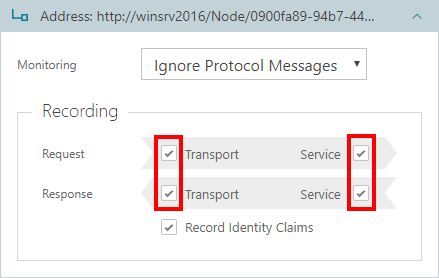
Inbound endpoints can also be enabled with the option to Record Identity Claims found in Request messages. Inbound endpoints always monitor client inbound identities. These identities can be recorded in a short form of an identity Name claim or as a complete set of processed claims.
Check the Record Identity Claims box to record all claims about inbound caller identity. For example, Windows Active Directory account identity can be recorded as a Windows Account name in a short form (if Record Identity Claims is not check marked), or as a set of all Windows Active Directory claims associated with a Windows Account (if Record Identity Claims is check marked). An X.509 certificate can be recorded as a certificate Common Name in a short form, or as a set of all certificate claims in a full form.
Sentinet shows recorded claims in the following format:
Claims Issued By '[Claim Issuer]’ for Identity: [X]:
*[Claim Type] : ‘[Claim Value]’
The diagram below shows example of 14 recorded claims issued by some authority identified as https://sts.windows.net/1f03adea-53d3-4b03-867e-72d6e315d887/ , where the first claim has claim type aud with its value, https://bizsparknevatech.onmicrosoft.com/basiccalculator, the second claim has claim type iss with its value https://sts.windows.net/1f03adea-53d3-4b03-867e-72d6e315d887/, and so on.
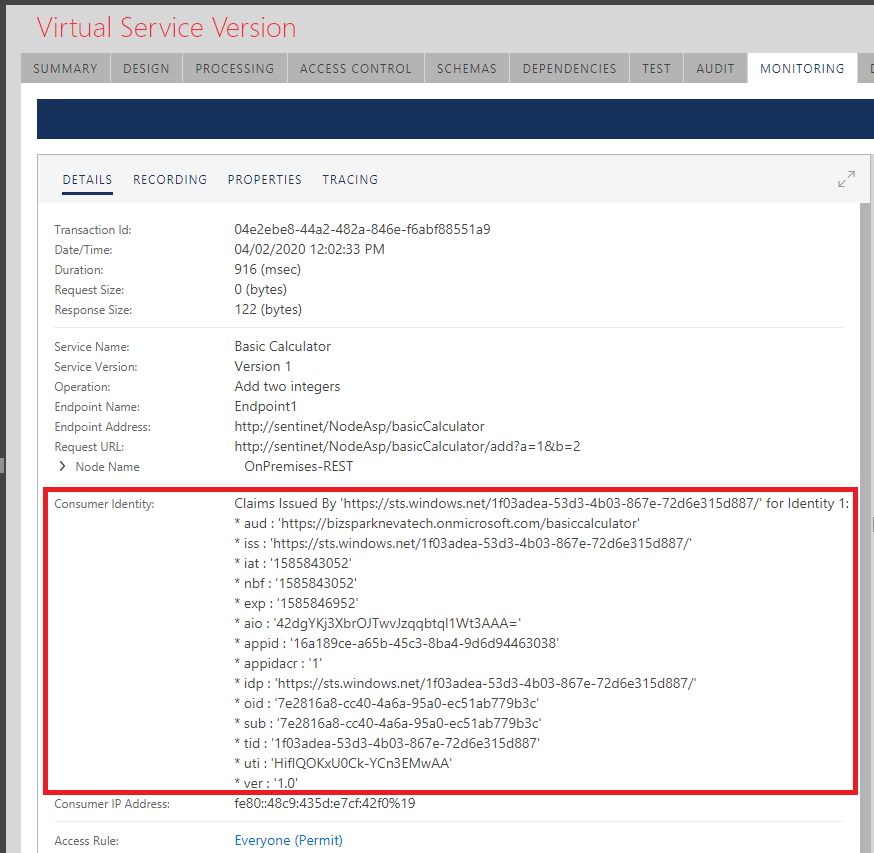
Enabling the Record Identity Claims option is particularly valuable when identity claims are issued by an external Security Token Services (like Microsoft Azure Active Directory, Windows ADFS 2.0/3.0 or any other OAuth server) and the claims are coming from inbound SAML or JWT OAuth tokens. In this case Access Rules created for the virtual services can use Claim Authorization Expression to control access to virtual services based on issued claims and their values.
Sentinet simplifies monitoring options assignment by providing a few built-in monitoring profiles that assign the same monitoring and recording options for all virtual service endpoints. The initial monitoring profile for a new virtual service can be changed by User Preferences. By default, the initial monitoring profile is Default for all virtual services.
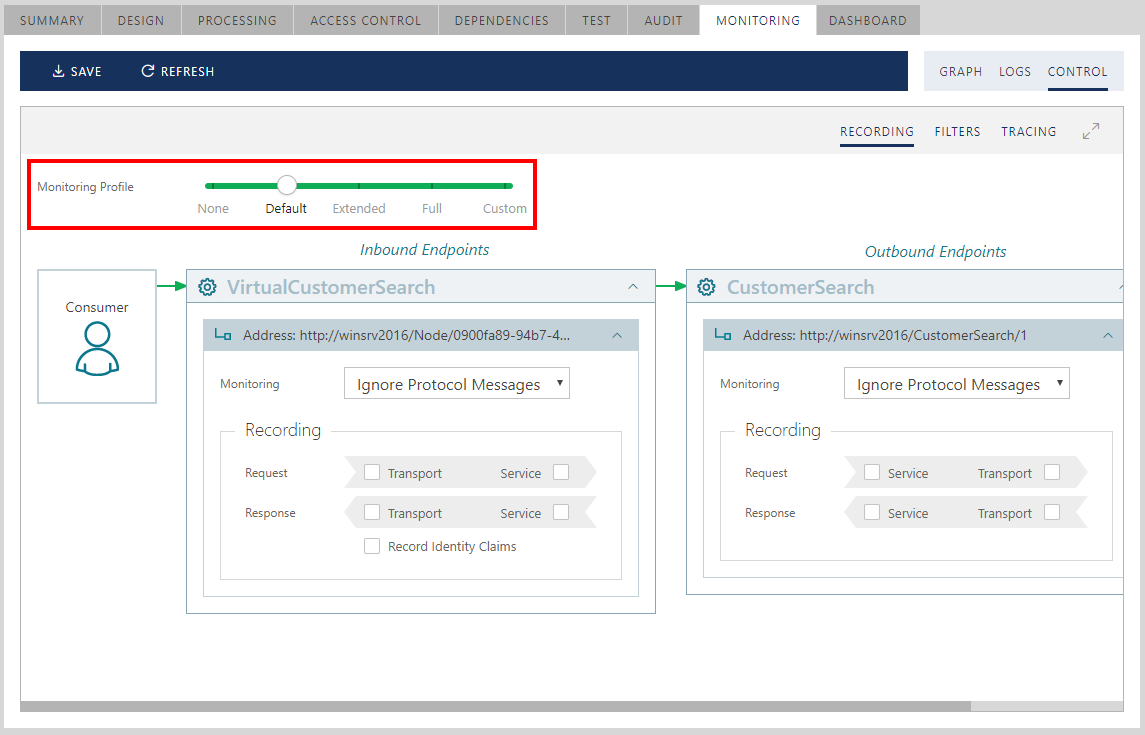
| Monitoring Profile | Description |
|---|---|
| None | Monitoring is set to Off. Messages recording is turned off. |
| Default | Monitoring is set to Ignore Protocol Messages. Messages recording is turned off. |
| Extended | Monitoring is set to Ignore Protocol Messages. Messages recording is turned on only at the Transport recording points. |
| Full | Monitoring is set to Include Protocol Messages, and message recording is turned on at all recording points, with the Record Identity Claims option turned on. If you want to use this Monitoring Profile for REST services, use Extended profile instead, because for REST services Full profile does not provide any additional benefits compared to Extended profile. |
| Custom | Any combination of Monitoring and Recording options (checkmarks) that is different from the four profile options above. |
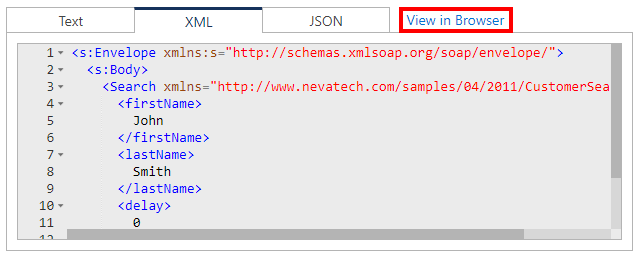
When messages recording is turned on, they will show up in the RECORDING tab in the transaction segment details view. The RECORDING tab will show a diagram of available message recording points color-coded with the status of the recorded messages. If the recording endpoint was not configured with payload recording or payload is not available at this recording point, it will be shown in gray. Click on any green recording point to select and review a recorded message at that selected recording point in Text, XML or JSON format. Some recording points may not produce any text, because messages can be binary-encoded (for example, net.tcp:// transport recording endpoints with binary encoder).
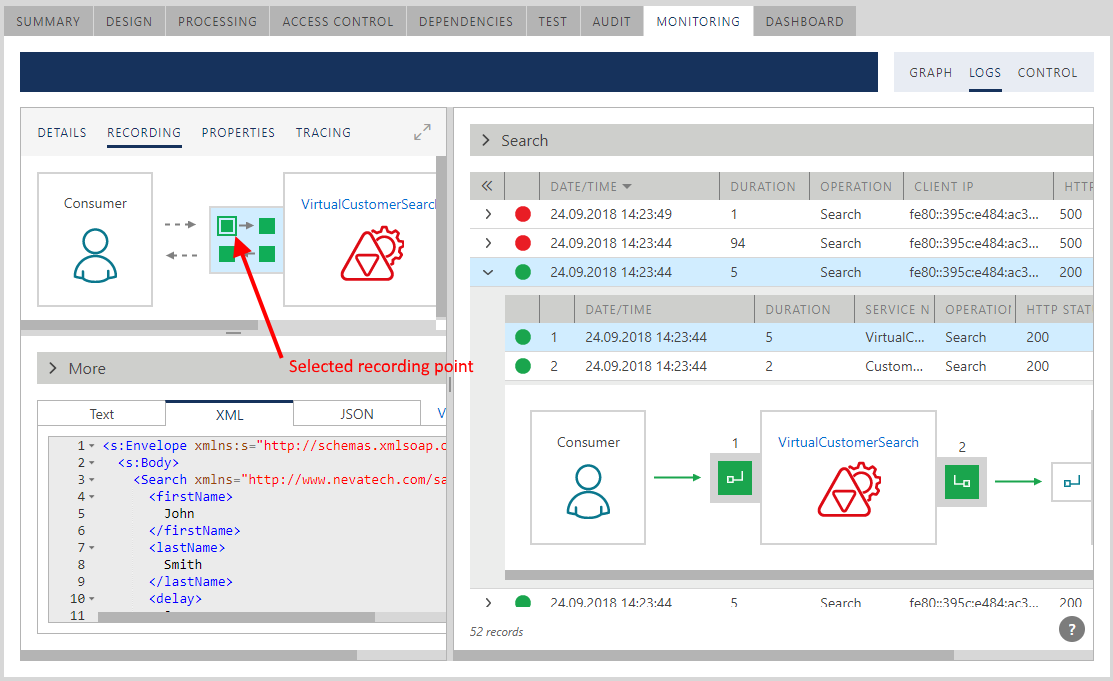
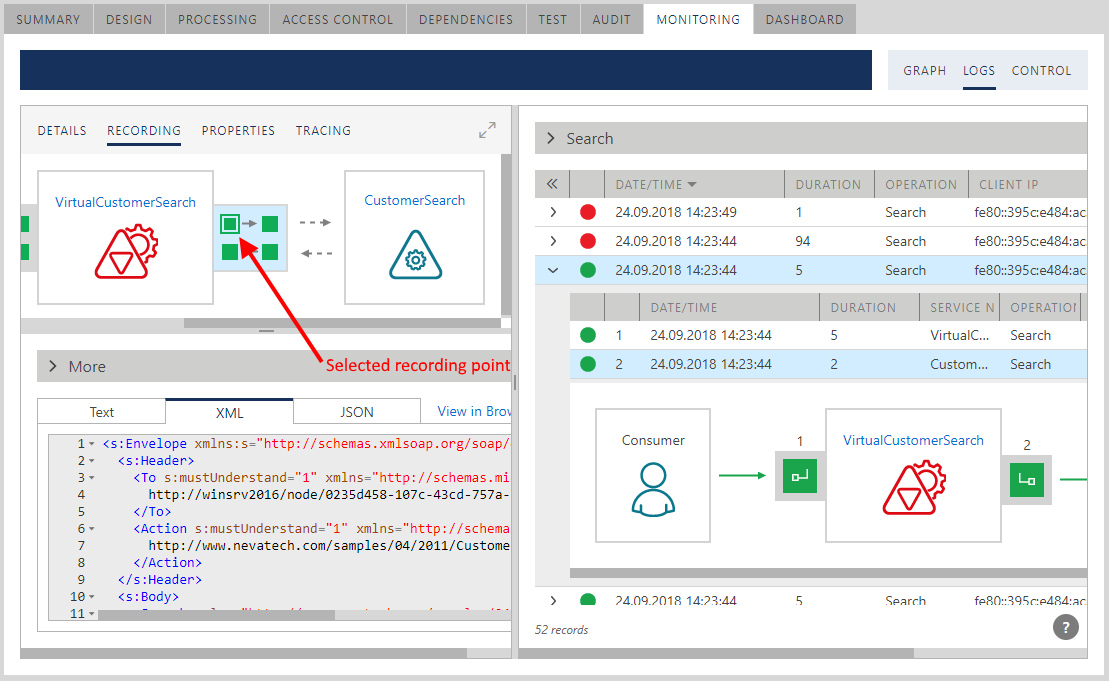
A user may click on any available recording point on the diagram to review details of the recorded message. Inbound segment 1 and outbound segment 2 (and possibly outbound segments 3, 4 when Sentinet is implementing routing between many endpoints) will be shown in selected background color. DETAILS tab will show details of that selected transaction segment while RECORDING tab shows recorded messages at the selected recording point within the selected transaction segment. Users can set this part of the screen to full screen mode and hover mouse over any service on the diagram to quickly navigate in the Repository to that service version.
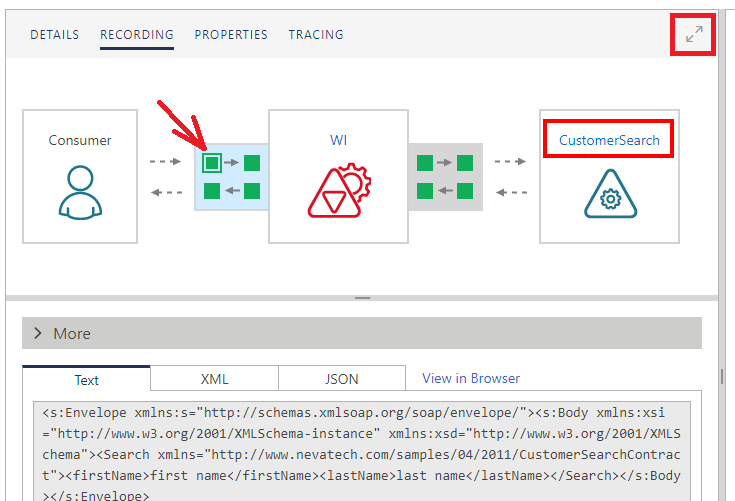
Recorded messages can also be viewed in a new browser window (new browser tab).
Note
Access to message content from an external browser session is provided only to authenticated and authorized Sentinet users.
Monitoring Filters
Monitoring Filters can filter recorded messages’ content before messages are recorded in the Sentinet Repository.
Note
Messages will still be transmitted through Sentinet Node(s) unchanged. Monitoring Filters only control how they will be recorded.

All Monitoring Filters will be applied at each recording endpoint described above. Filters are configured via XML configuration. Currently two filters are supported, built-in Masking Filter and Custom Filter. Below is a generic format of the Monitoring Filters XML configuration:
<MONITORING-FILTERS>
 <CUSTOM-FILTER name=”” type=””>[optional filter configuration]</CUSTOM-FILTER>
 <MASKING-FILTER>
   <SCOPE operation="..." >
     <URI>
       <!-- masking expressions -->
       <REGEX-REPLACE expression="" replacementValue="" />
       <XPATH-REPLACE xmlns:a="[namespace1]" xmlns:b="[namespace1]" … expression="" replacementValue="" />
       <JSON-POINTER-REPLACE expression="" replacementValue="" />
       <JSON-PATH-REPLACE expression="" replacementValue="" />
     </URI>
     <REQUEST>
       <HTTP-HEADER name="...">
         <!-- masking expressions -->
         … (see above)
       </HTTP-HEADER>
       <HTTP-HEADER .../>
       <BODY>
         <!-- masking expressions -->
         … (see above)
       </BODY>
     </REQUEST>
     <RESPONSE>
       <HTTP-HEADER ...>
         <!-- masking expressions -->
         … (see above)
       </HTTP-HEADER>
       <HTTP-HEADER .../>
       <BODY>
         <!-- masking expressions -->
         … (see above)
       </BODY>
     </RESPONSE>
     <FAULT>
       <HTTP-HEADER ...>
         <!-- masking expressions -->
         … (see above)
       </HTTP-HEADER>
       <HTTP-HEADER .../>
       <BODY>
         <!-- masking expressions -->
         … (see above)
       </BODY>
     </FAULT>
   </SCOPE>
   ...
   <SCOPE ...=""/>
 </MASKING-FILTER>
</MONITORING-FILTERS>
Any XML element in this generic XML configuration can be empty. Any empty XML element except <MONITORING-FILTERS> can be omitted from the XML configuration. By default, a virtual service does not have any filters, so its default XML configuration is only one empty root element, <MONITORING-FILTERS/>.
Filters are executed in a sequential order, from top to bottom. Built-in Masking Filter never stops execution of a chain. If it is added to Monitoring Filters collection it will always let next filter in the chain to be executed too. Custom Filter can be coded not to call next filter in the chain, in which case execution flow of filters will be stopped.
Masking Filter
A Masking Filter (<MASKING-FILTER> XML element) defines where and how filtering occurs. Below is the description of each XML configuration element:
SCOPE element defines a single monitoring filter that will be applied to specific service operation(s) only. Service operation is identified by its name in operation XML attribute. Operation name can contain wildcards such as * or ? characters. <MASKING-FILTER> element may contain more than one SCOPE child elements.
A single SCOPE element may contain configuration for up to three different kinds of messages. Those are <REQUEST> message’s headers and body, <RESPONSE> message’s headers and body, and <FAULT> message’s headers and body (<FAULT> are applicable to SOAP services only). Fourth element, <URI> can be added to handle Request’s URI specifically.
URI element contains masking expression elements. Currently three masking expressions are supported, <REGEX-REPLACE>, <XPATH-REPLACE> and <JSON-REPLACE>. These elements specify how to replace the content. Note, that for URI element specifically, only <REGEX-REPLACE> sub-element makes sense, other two are available only for completeness.
For example, suppose that original request message has URI with ApiKey query parameter and the value of this query parameter should be masked preserving its first 5 characters:
https://sentinet/Node/myapi/add?a=1&b=2&apiKey= _Glh7A6ppFZVRHJ492Vg-rAVa8qF25ChRAjylEE9jnB3yJtS-VoKlTM7Ect1cSTn&x=123
If you specify Masking Filter as below:
<MONITORING-FILTERS>
 <MASKING-FILTER>
   <SCOPE operation="*" >
     <URI>
       <REGEX-REPLACE expression="(?i)(apikey)(?-i)=([\-_A-z0-9]{5})([\-_A-z0-9]+)"
       replacementValue="$1=$2*****" />
     </URI>
     <REQUEST />
     <RESPONSE />
     <FAULT />
   </SCOPE>
 </MASKING-FILTER>
</MONITORING-FILTERS>
Recorded request URI will show:
https://sentinet/Node/myapi/add?a=1&b=2&apiKey= _Glh7*****&x=123
<REGEX-REPLACE> element specifies that Regular Expression will be used to modify the content. XML attribute expression specifies regular expression, while replacementValue attribute specifies what will be the replacement value. For example:
<REGEX-REPLACE replacementValue="" expression="\b[a-z]\w+" />
<XPATH-REPLACE> element specifies that XPath expression will be used to modify the content. XML attribute expression specifies XPath expression, while replacementValue attribute specifies what will be the replacement value. <XPATH-REPLACE> element also supports one or more xmlns:prefix elements. For example:
<XPATH-REPLACE xmlns:c="http://myns.com/c" xmlns:b="http://myns.com/b" replacementValue="YYY" expression="/b:test/c:test" />
<JSON-POINTER-REPLACE> element specifies that JSON Pointer expression will be used to modify the content. JSON Pointer syntax is described by this specification https://tools.ietf.org/html/rfc6901.
XML attribute expression specifies JSON Pointer expression, while replacementValue attribute specifies what will be the replacement value. The replacementValue attribute must contain a valid JSON, which means that the value of this attribute may require XML encoding for some of its characters (like double quote character). For example, suppose that original request message for operation PlaceOrder was:
{
   "order": {
   "UserId": 123,
   "User": "John Smith",
   "Amount": 35.67,
   "CreditCard": "1234123412341234"
   }
}
If you configure Masking Filter as below:
<MONITORING-FILTERS> <MASKING-FILTER> <SCOPE operation="PlaceOrder"> <REQUEST> <BODY> <JSON-POINTER-REPLACE expression="#/order/Amount" replacementValue="0" /> <JSON-POINTER-REPLACE expression="#/order/CreditCard" replacementValue=""***"" /> </BODY> </REQUEST> <RESPONSE /> <FAULT /> </SCOPE> </MASKING-FILTER> </MONITORING-FILTERS>Recorded request will show:
{
   "order": {
       "UserId": 123,
       "User": "John Smith",
       "Amount": 0,
       "CreditCard": "***"
   }
}
<JSON-PATH-REPLACE> element specifies that JSON Path expression will be used to modify the content. JSON Pointer syntax is described by this specification https://tools.ietf.org/id/draft-goessner-dispatch-jsonpath-00.html.
XML attribute expression specifies JSON Path expression, while replacementValue attribute specifies what will be the replacement value. The replacementValue attribute must contain a valid JSON, which means that the value of this attribute may require XML encoding for some of its characters (like double quote character). For example, suppose that original request message for operation PlaceOrder was:
{
   "order": {
       "UserId": 123,
       "User": "John Smith",
       "Amount": 35.67,
       "CreditCard": "1234123412341234"
   }
}
If you configure Masking Filter as below:
<MONITORING-FILTERS> <MASKING-FILTER> <SCOPE operation="PlaceOrder"> <REQUEST> <BODY> <JSON-PATH-REPLACE expression="$.order.Amount " replacementValue="0" /> <JSON-PATH-REPLACE expression="$.order.CreditCard " replacementValue=""***"" /> </BODY> </REQUEST> <RESPONSE /> <FAULT /> </SCOPE> </MASKING-FILTER> </MONITORING-FILTERS>Recorded request will show:
{ "order": { "UserId": 123, "User": "John Smith", "Amount": 0, "CreditCard": "***" } }<REQUEST>, <RESPONSE> and <FAULT> elements have the same structure, which may include one or more <HTTP-HEADER> elements and one <BODY> element.
<HTTP-HEADER> element specifies HTTP header, the content of which must be replaced. A header is identified by its name in the name attribute. Header name can contain wildcards such as * or ? characters.
<BODY> element may contain any number of masking expressions described above (items 4, 5, 6 and 7).
<URI>, <HTTP-HEADER> and <BODY> elements may contain any number of masking expressions (items 4, 5 and 6 described above).
Custom Filter
A Custom Filter (<CUSTOM-FILTER> XML element) provides configuration for a custom .NET assembly and a custom .NET class (type) that implements IMonitoringFilter interface:
namespace Nevatech.Vsb.Repository.Monitoring.Filters
{
   public interface IMonitoringFilter
   {
       // Imports component's optional configuration
       void ImportConfiguration(string configuration);

       // Writes Monitoring Property
       void WriteProperty(MonitoringTransactionProperty property, MonitoringFilterContext context,
         MonitoringFilterBase nextFilter);

       // Writes the body of the recorded message
       void WriteRecord(MonitoringRecord record, MonitoringFilterContext context,
         MonitoringFilterBase nextFilter);

       // Writes minimum standard information about transaction
       void WriteTransaction(MonitoringTransaction transaction, MonitoringFilterContext context,
         MonitoringFilterBase nextFilter);
   }
}
Custom Filter may be created for the purpose of:
- Implementing custom filtering and/or masking of the recorded messages that cannot be covered by the built-in Masking Filter.
- Implementing custom logging of the recorded messages in addition to Sentinet default recording.
- Implementing custom logging of the recorded messages instead of Sentinet default recording.
<CUSTOM-FILTER> element has the following configuration format:
<CUSTOM-FILTER name="[friendly name]" type="[fully qualified .net type. For example: mynamespace.myclass, myassembly, Version=1.0.0.0, Culture=neutral, PublicKeyToken=myassembly_public_token]">
   [optional configuration string]
</CUSTOM-FILTER>
Every Write… method of the IMonitoringFilter interface should call nextFilter.Write… in order to let Monitoring Filters collection to execute next filter in the Monitoring Filter’s chain, otherwise execution of the chain will stop for this particular Write… method.
Compiled custom .NET assembly, which implements one or more custom monitoring filters must be placed on the Sentinet Node server machine(s) either in the bin folder of the Node application (create bin folder if it does not exist), or it can be registered in machine’s GAC.
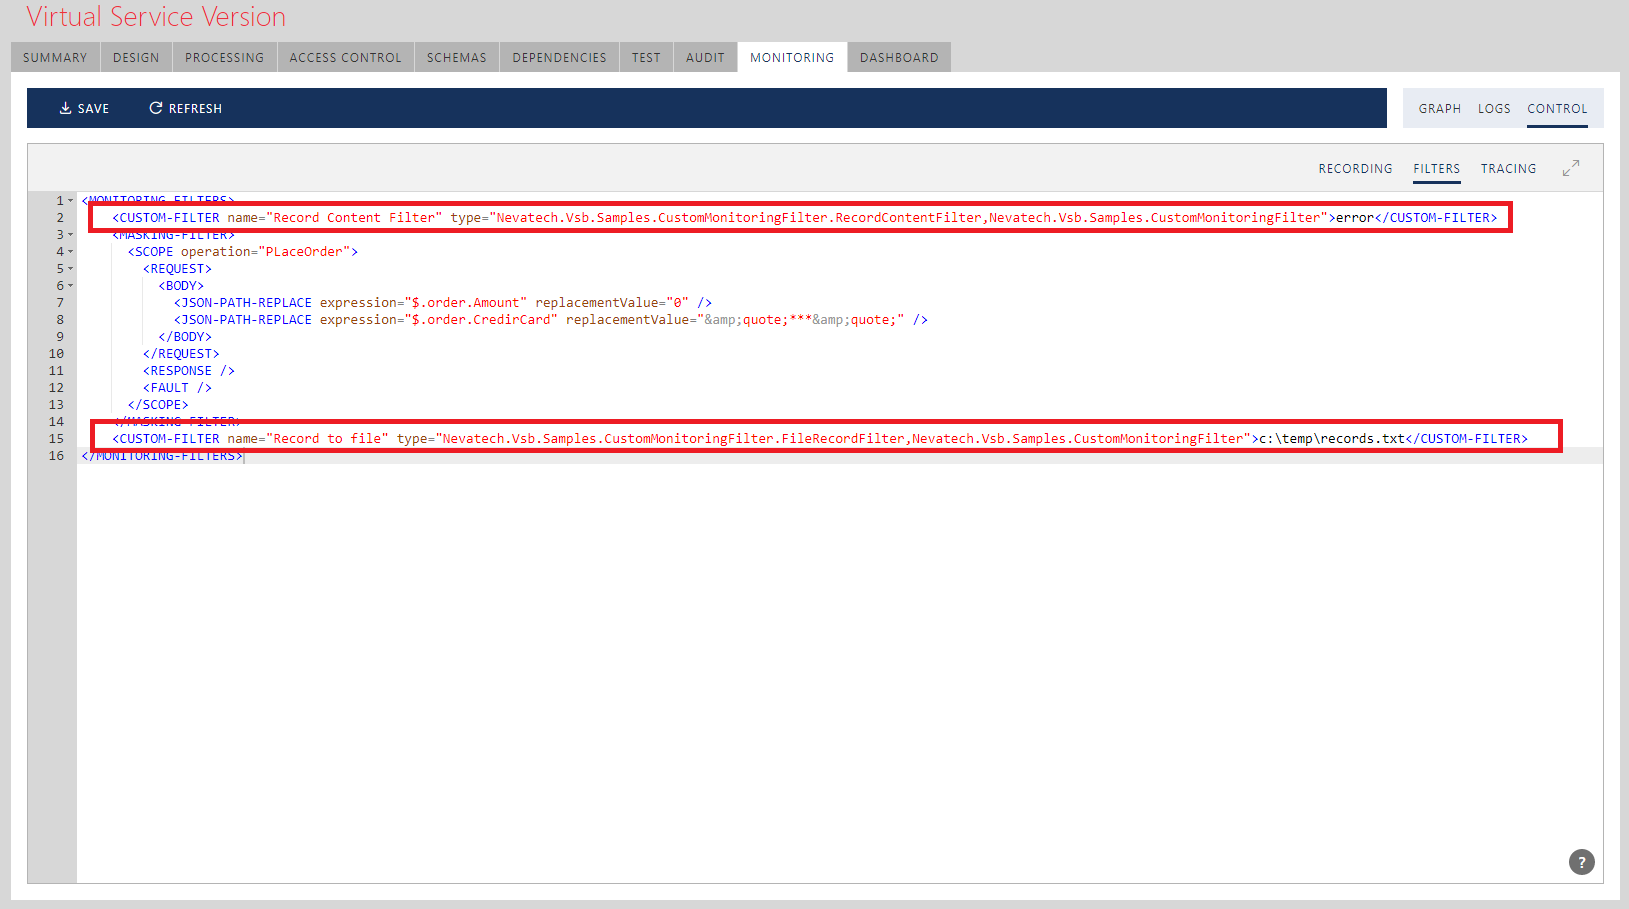
Sentinet is shipped with the sample Visual Studio .NET project, CustomMonitoringFilter, which includes sample code for two Custom Filters.
Tracing
Tracing section provides settings to enable or disable (default is disabled) tracing of the virtual service’s Access Rules execution, Pipeline execution and OAuth execution (see Tracing chapter for more details).
