Dashboard
Dashboard shows general Analytics, state Summary of API Products' engagement by the Developer Portal Consumer account, and current state of API Keys.
Analytics
Analytics shows usage data for Subscriptions and APIs. You can request numbers of results (rows) returned by data query for arbitrary date/time interval.
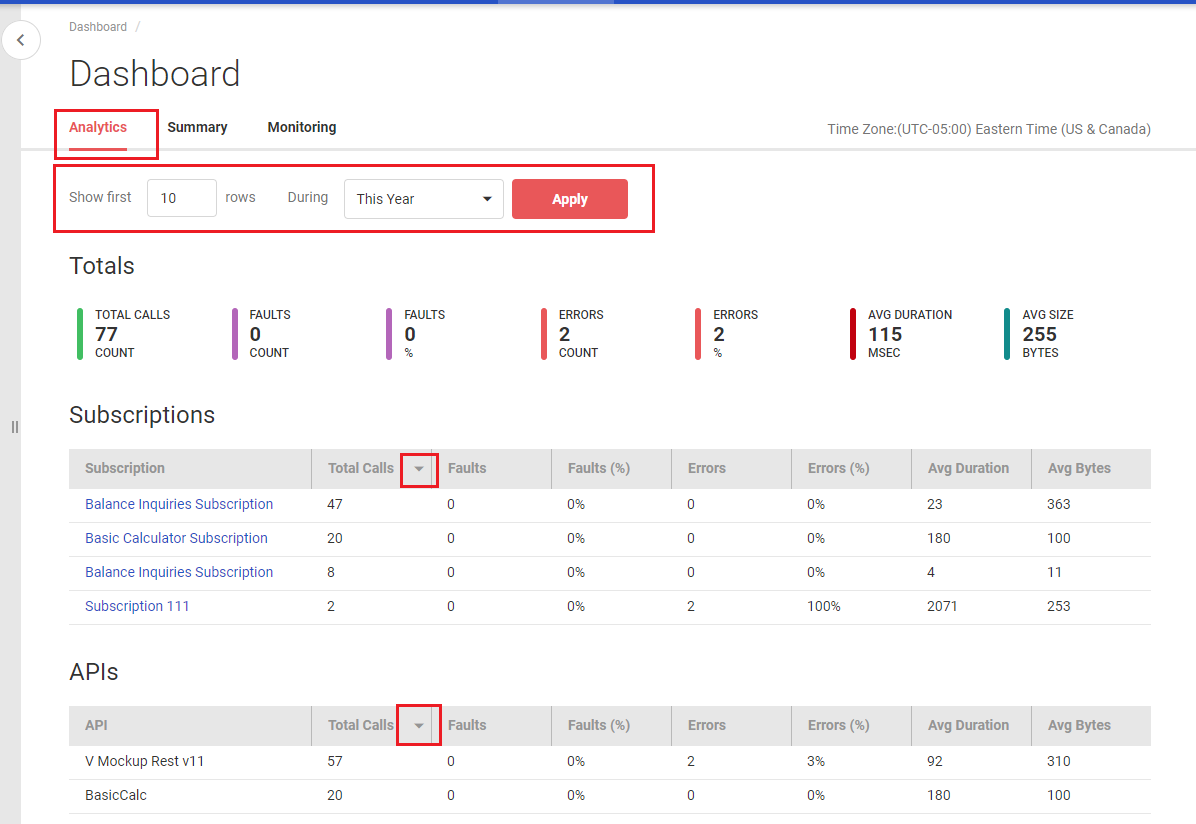
When you click sorting button, you do not actually sort result in ascending or descending order, rather you indicate which metric will be used to return first X top rows in the search. For example, if Total Calls columns is “sorted”, you get X top most used Subscriptions or APIs, if Avg Duration (average duration) column is selected, you get different result of X top Subscriptions or APIs that are least responsive (have the highest average duration).
Summary
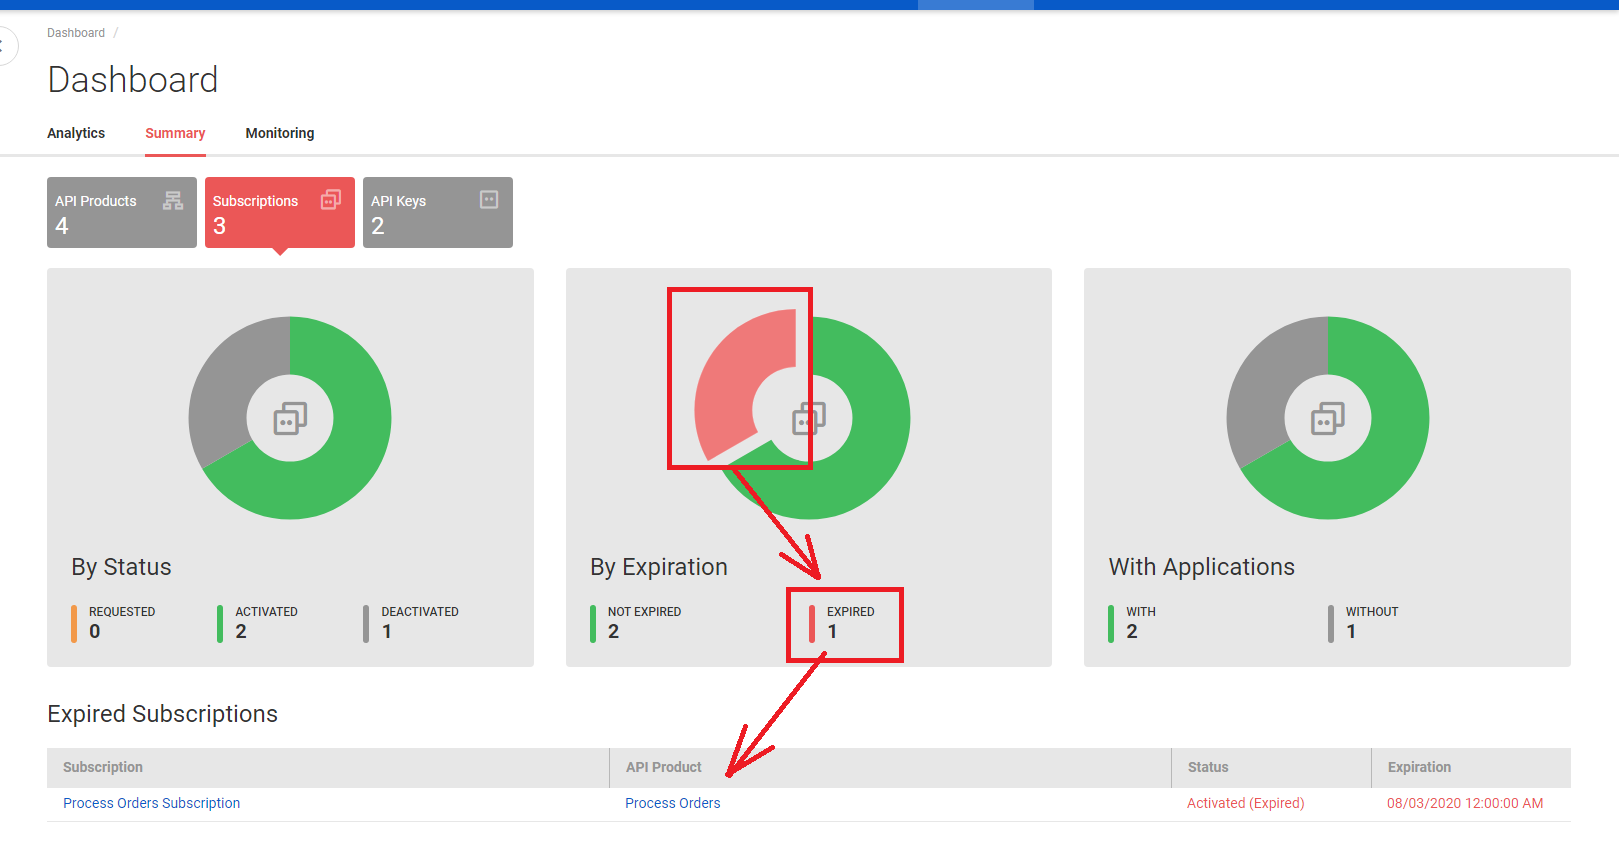
Dashboard Summary shows API Products' engagement by the Developer Portal Consumer account. You can see if offered API Products have Consumer's Subscriptions, what are current Subscriptions' different states, and API Keys' expiration states.
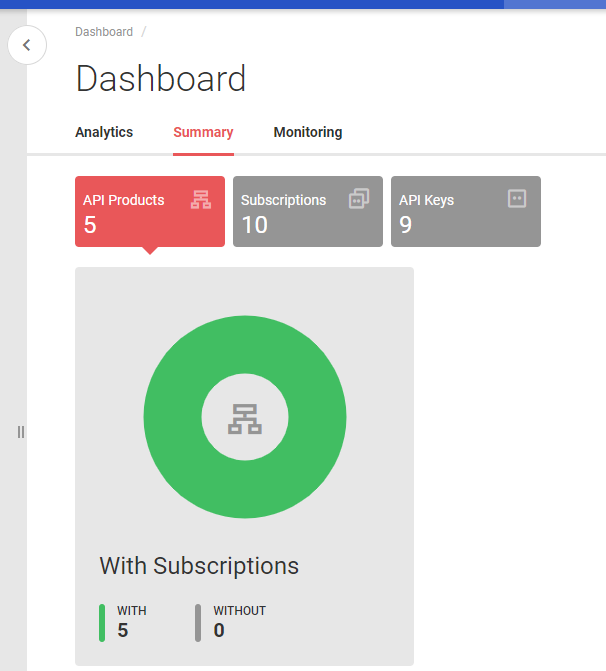
Each doughnut chart is drill-down clickable to produce the list of entities and their states related to the selected segment of a chart. Selected segment is “exploded” away from the center of a doughnut.
Monitoring
Monitoring tab gives capability to monitor all transactions in real-time and historically across the entire Consumer account. Monitoring features and User Interface is very similar to the Monitoring of individual Subscriptions.