Dashboards
There are two types of dashboards provided by the Sentinet Administrative Console, they can be found at the DASHBOARD tab for Repository items that have this tab, and/or at the SUMMARY tab for some Repository items listed below. DASHBOARD tab shows Analytical Reports about the service and API messages processed by the Sentinet. SUMMARY tab shows Statistical Reports data about Sentinet’s current Repository configuration and the state of its registered items.
Analytical Reports
Analytical Reports are available for a Folder tree element (including root Repository tree item), a Physical Services group tree item, a Virtual Services group tree item, an individual Physical or Virtual service container tree item, and an individual Physical or Virtual service version tree item.
Dashboards provide reports associated with the selected Repository tree item. Sentinet provides two types of analytical reports -- Top Services and Service Version Details reports.
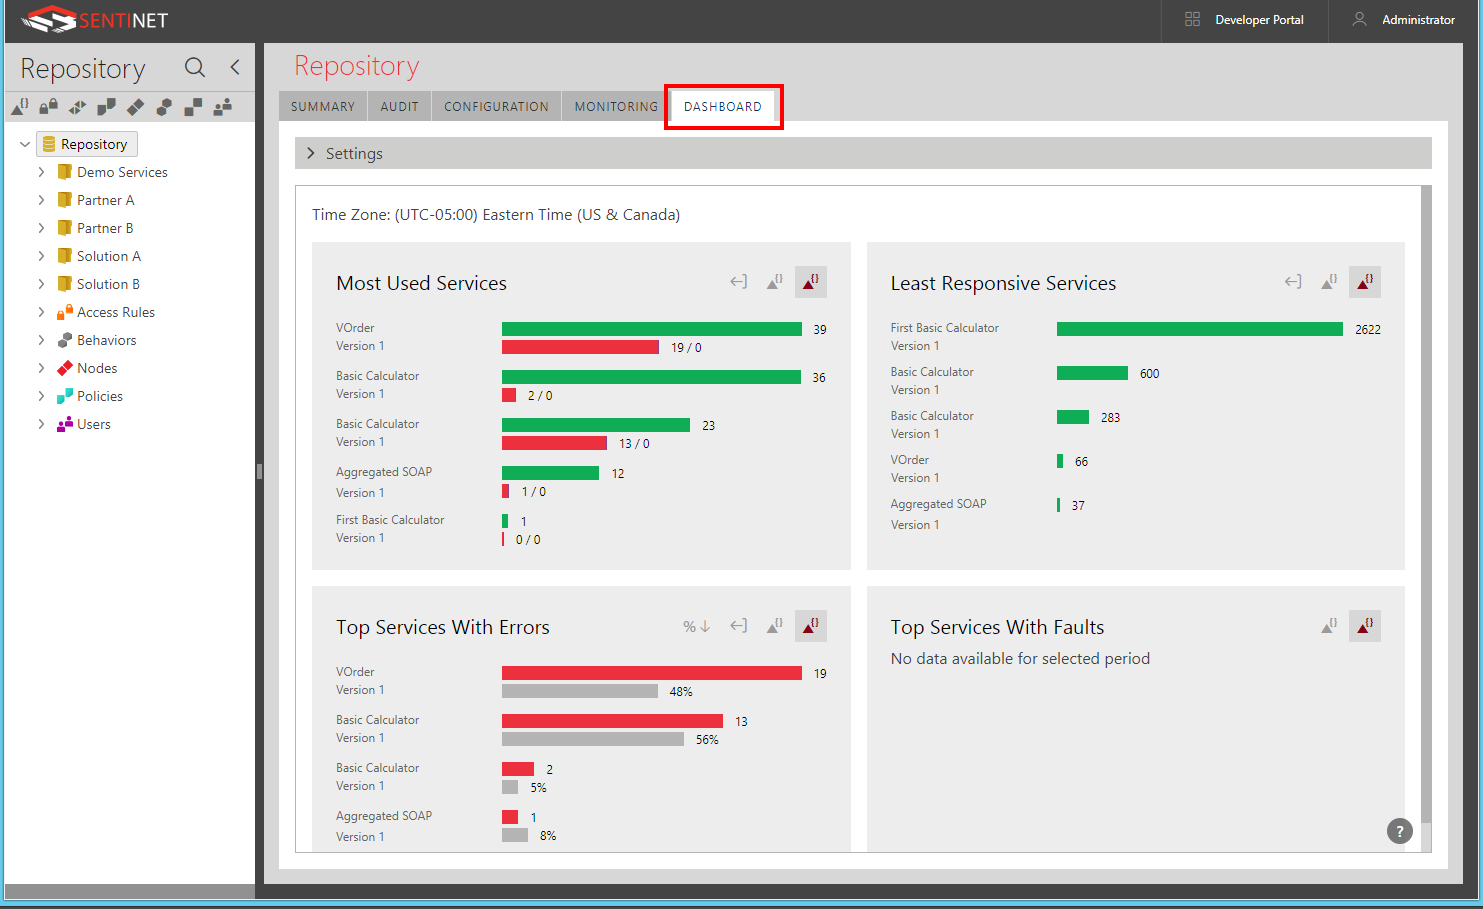
Top Services Reports
Top Services Reports can be generated for:
All services located in the selected Repository folder and all its subfolders (selecting Repository root will generate Top Services reports for all services in the Repository).
All services located under selected Physical Services or Virtual Services group tree element.
By default, top services reports are generated to include the top 10 virtual service versions for the period covering Today in the Reporting Time Zone. See the Dashboard Settings chapter for alternative settings and advanced control of the Dashboard reports. There are four individual reports produced by Top Services:
Most Used Services -- services with most total calls.
Least Responsive -- services with the highest average duration (response times in milliseconds).
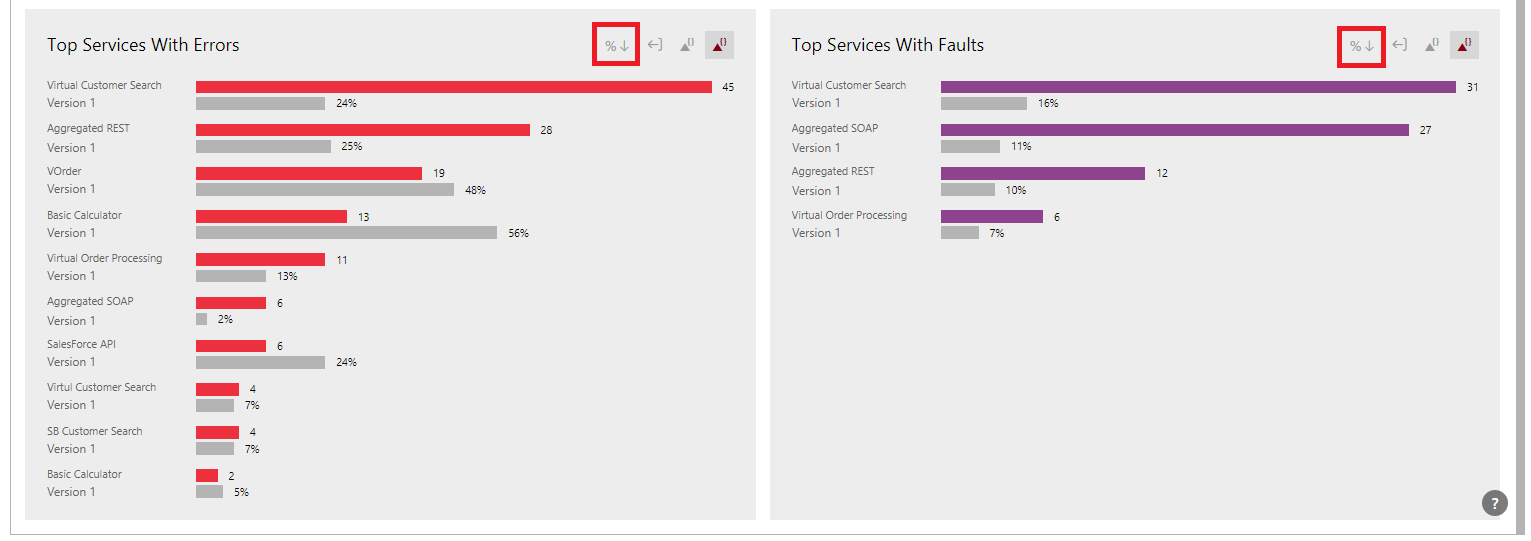
Top Services with Errors -- services with most total or % errors.
Top Services with Faults -- services with most total or % faults (application errors).
* see Transaction Status chapter for the description of differences between Errors and Faults.
Select the Repository folder to generate Top Services reports for that folder. Only services starting from the selected folder (including services in all subfolders) will be included in the reports.
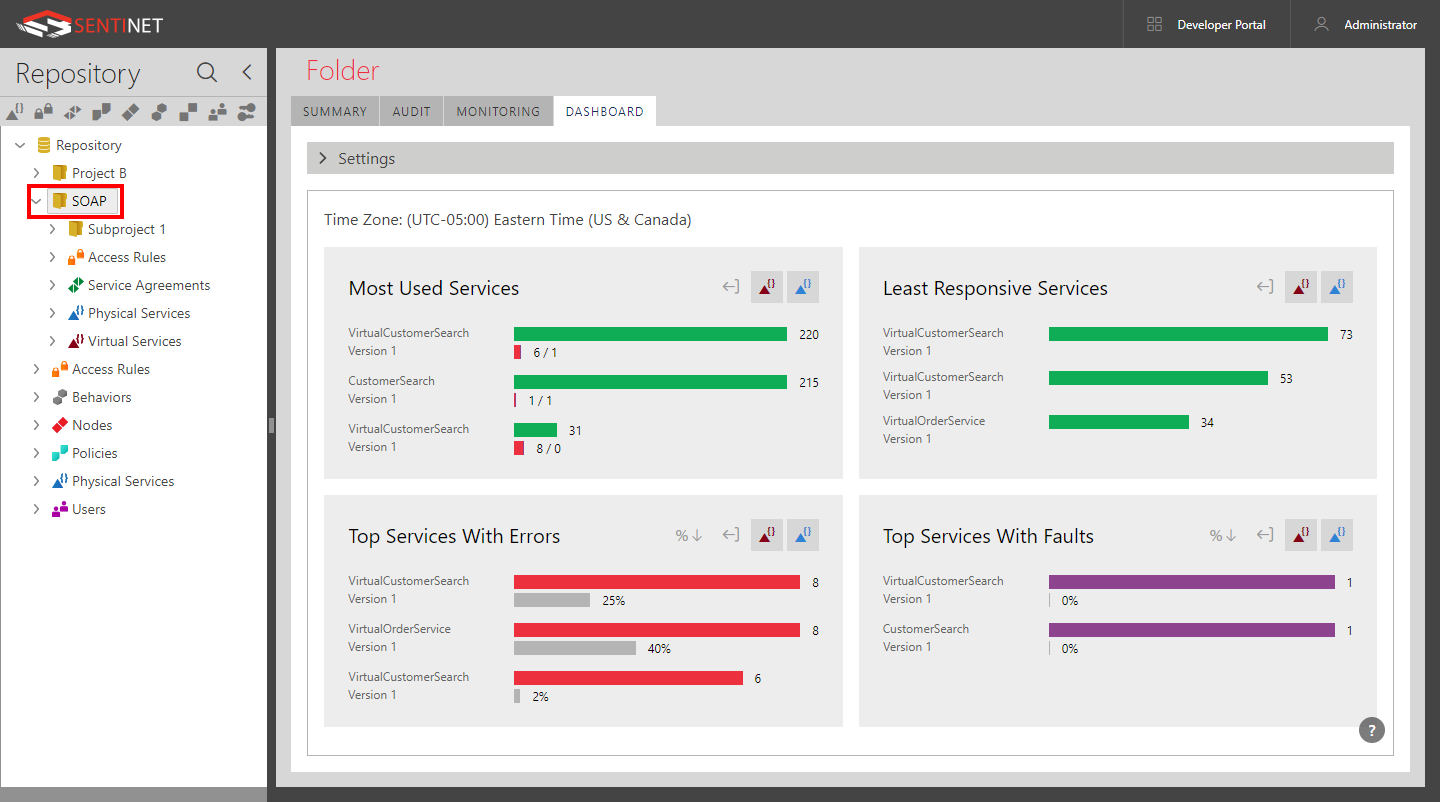
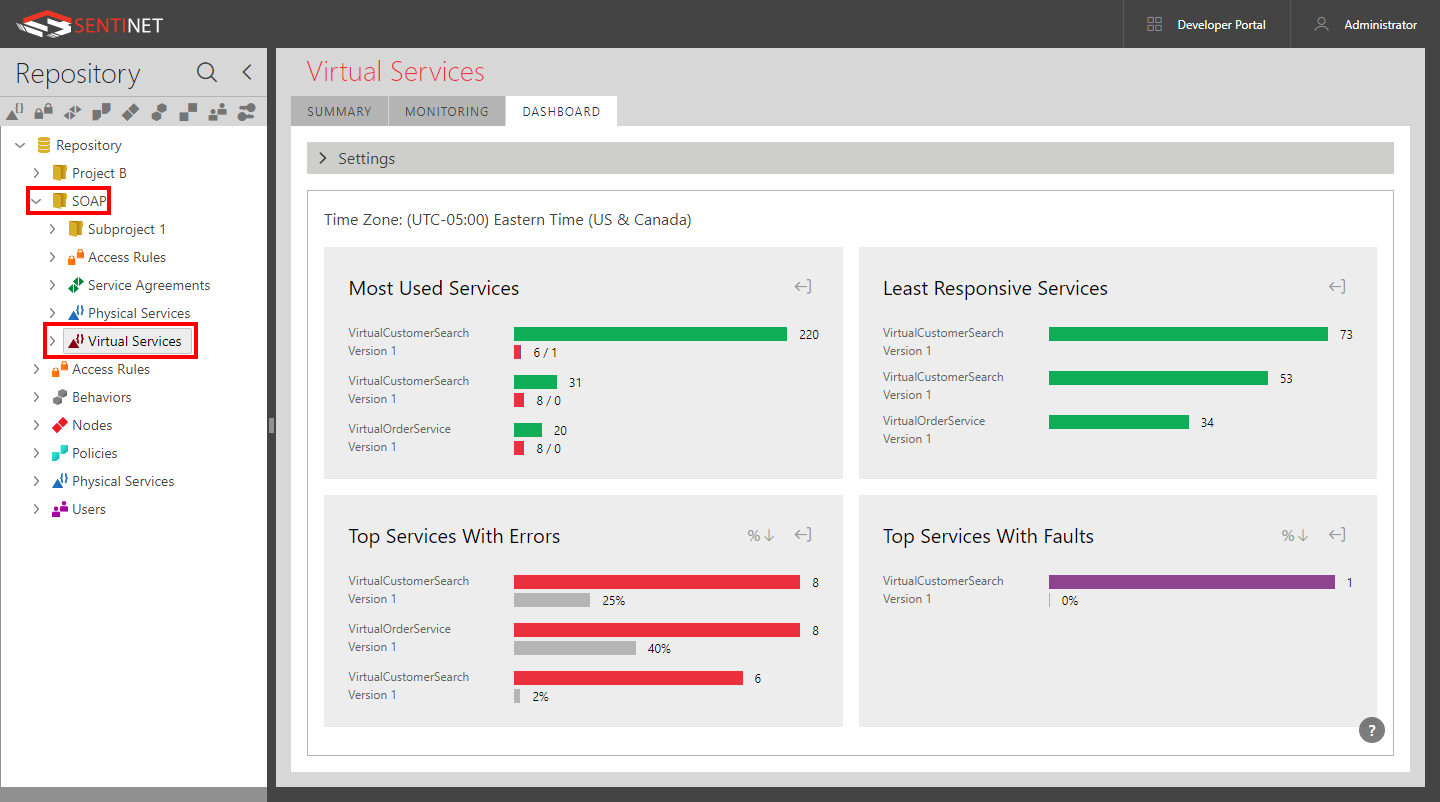
Select Physical Services or Virtual Services tree element in a specific folder to generate reports for either physical or virtual services located in this selected group tree element.
Each report can be re-generated to include physical, virtual or all services.
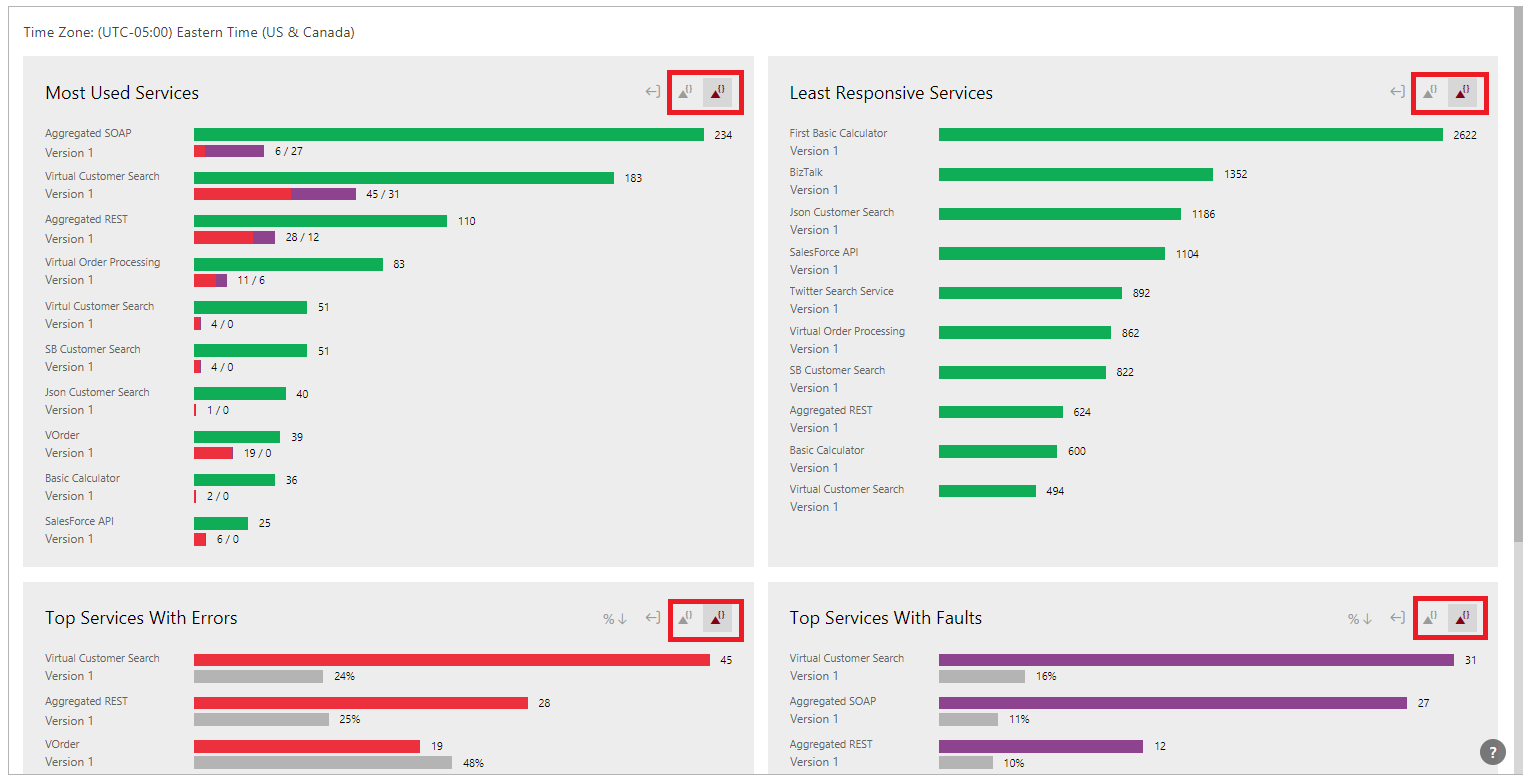
Top services With Errors and Top Services with Faults can be re-generated to sort the report's data by highest errors/faults count or by highest percent to total counts.
Service Version Details Reports
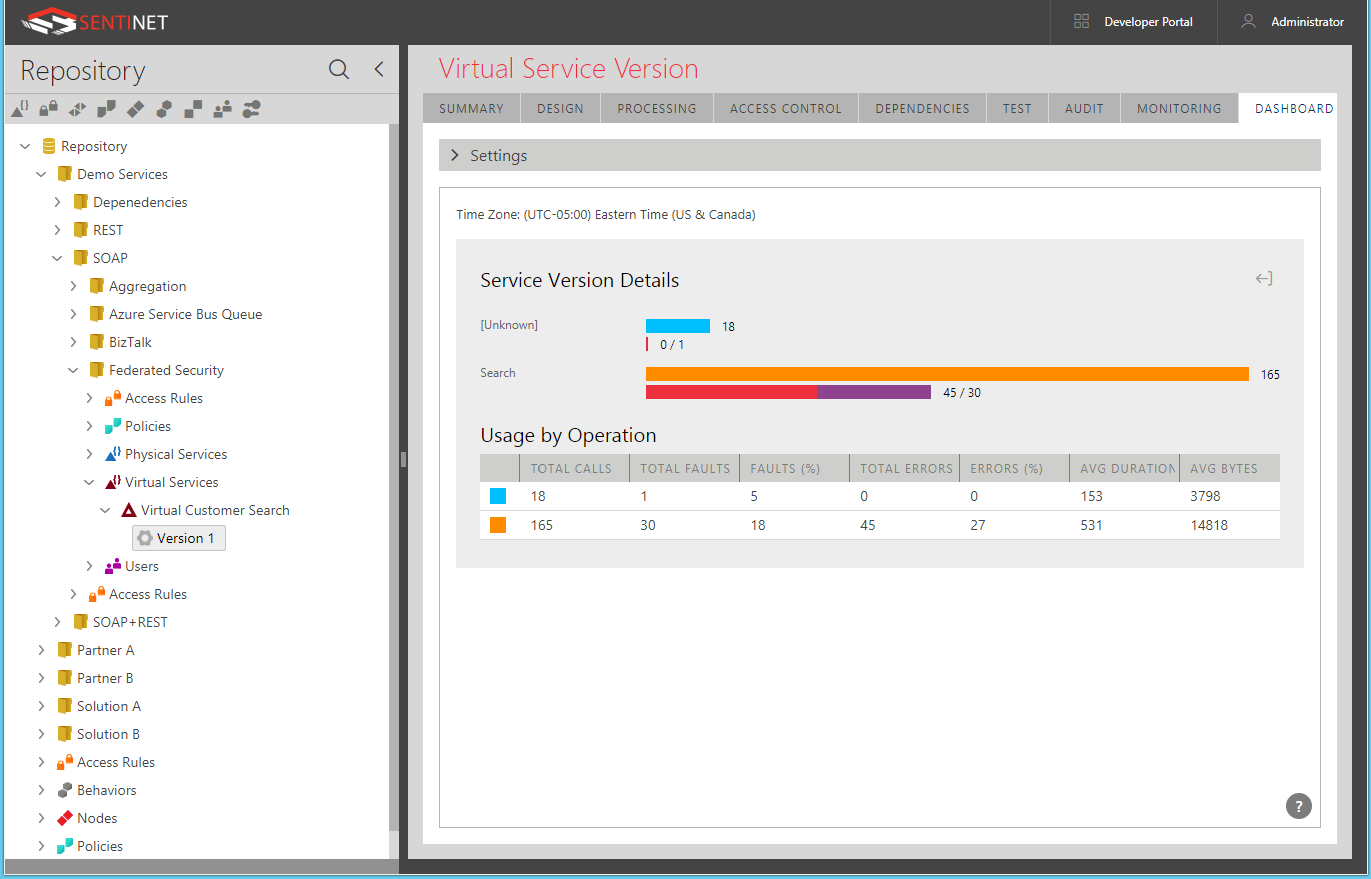
The Service Version Details report shows service statistics for each service operation. If a service was monitored with the monitoring configuration set to include protocol messages, all protocol-related messages will be grouped by the [Protocol Operation(s)] operation name. Some operations may be marked as [Unknown], because the Request URL of failed REST service calls will not match any existing service operation.
The Service Version Details report can be generated independently for any service version by selecting it in the Repository tree.
Dashboard Settings
Dashboard Settings section controls how analytical reports are generated. The following settings are available:
Select how many top services to include in the Top Services report (default is 10).
Check the Include Deleted Services box to include services that were deleted from the Repository but may still be included in the historical report. This may be a valuable option for historical reports that cover periods of time, during which some services might have been deleted. This setting is for Top Services reports.
Check the Include Deleted Operations box to include service operations that were deleted from the service but may still be included in the historical report. This setting is for Service Version Details reports.
Select an optional Access Rule to assign specific Access Rule that the monitoring data will be filtered by for the generated reports (default is [Any], the monitoring data is not filtered by any specific Access Rule).
Select a reporting time period from the During dropdown list (default is Today).
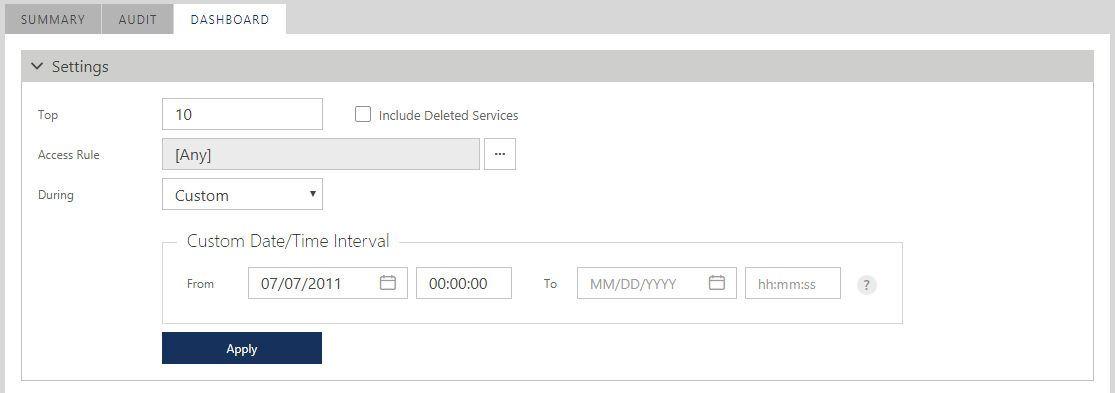
After changing settings on the screen above, click Apply button to regenerate report with the new settings.
Export Reports
Sentinet reports can be exported into Microsoft Excel XML Spreadsheet files. Even though these are flat XML files, they are formatted for and can be directly opened by Microsoft Excel.
To save report as a Microsoft Excel XML Spreadsheet file, click the Export Report button.
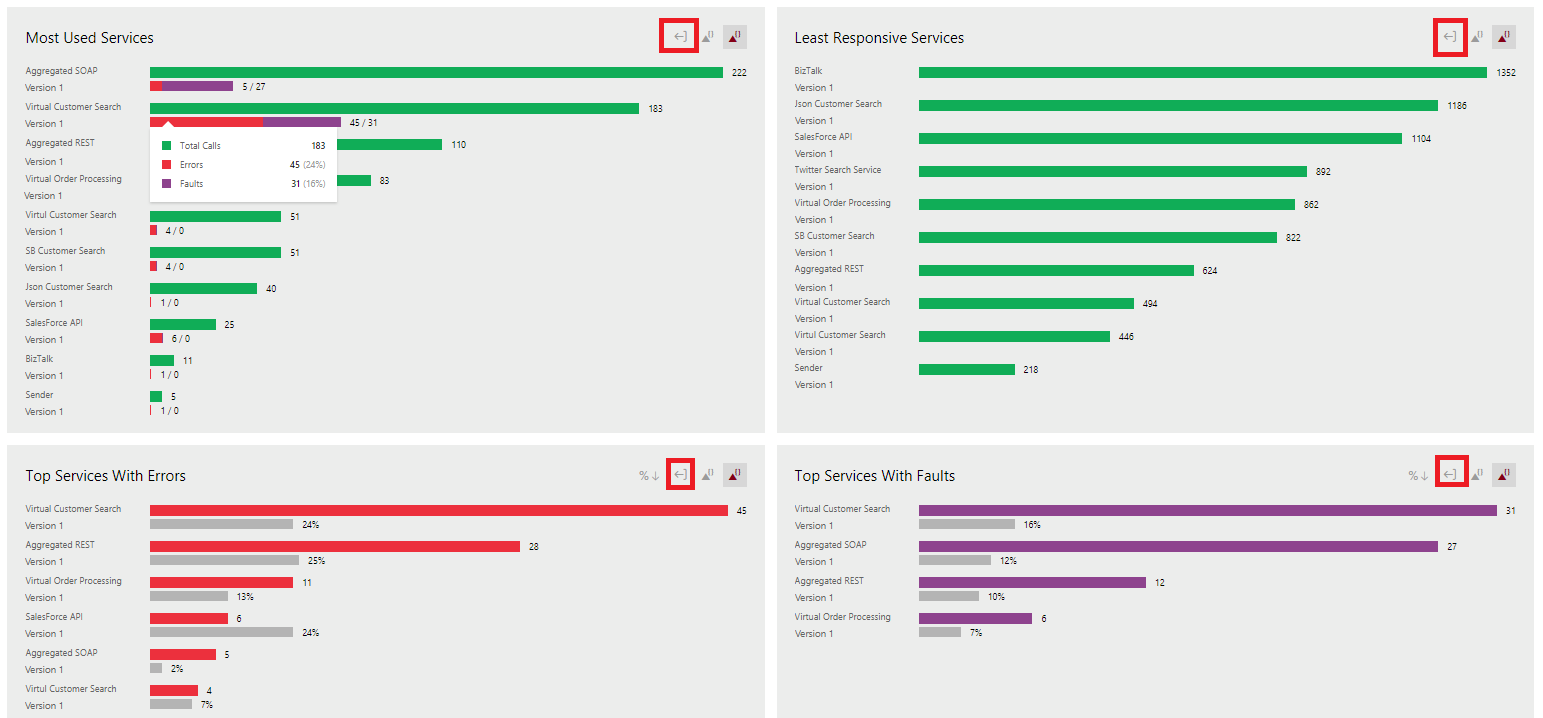
Once file is saved it can be opened by Microsoft Excel.
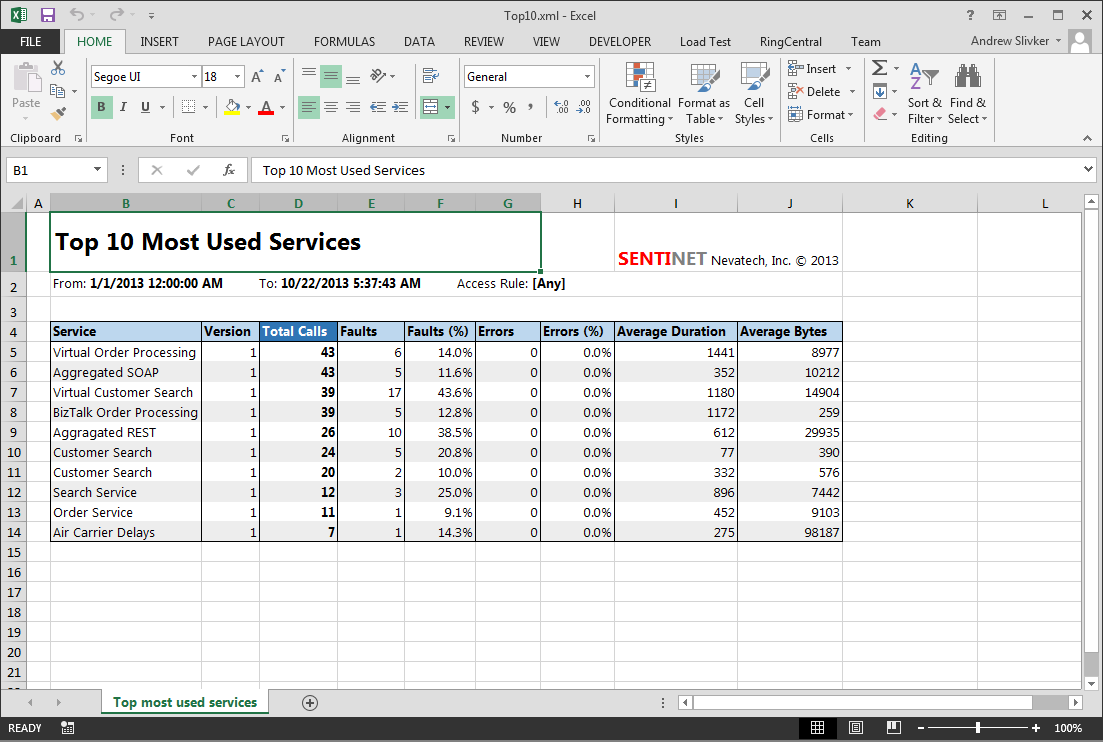
All exported Sentinet reports are generated from the reports XML template files. These files are located in the Reports directory of the Sentinet Repository Application (default location is C:\Program Files\Nevatech\Sentinet\Repository\Reports). Sentinet Administrators can customize these template files to give them a custom look and formatting.
Statistical Reports
Statistical Reports are available at the SUMMARY tab for certain Repository tree items. These reports help to quickly analyze the content of the Sentinet Repository (or some part of the Repository) in its current state. Reports are typically represented by the doughnut charts that show distribution of entities by different states and/or attributes. For example, if the root of the Repository tree item is selected, a user can find basic statistics of the total count of services in the entire Repository and its distribution between SOAP and REST services, and between Physical and Virtual services.
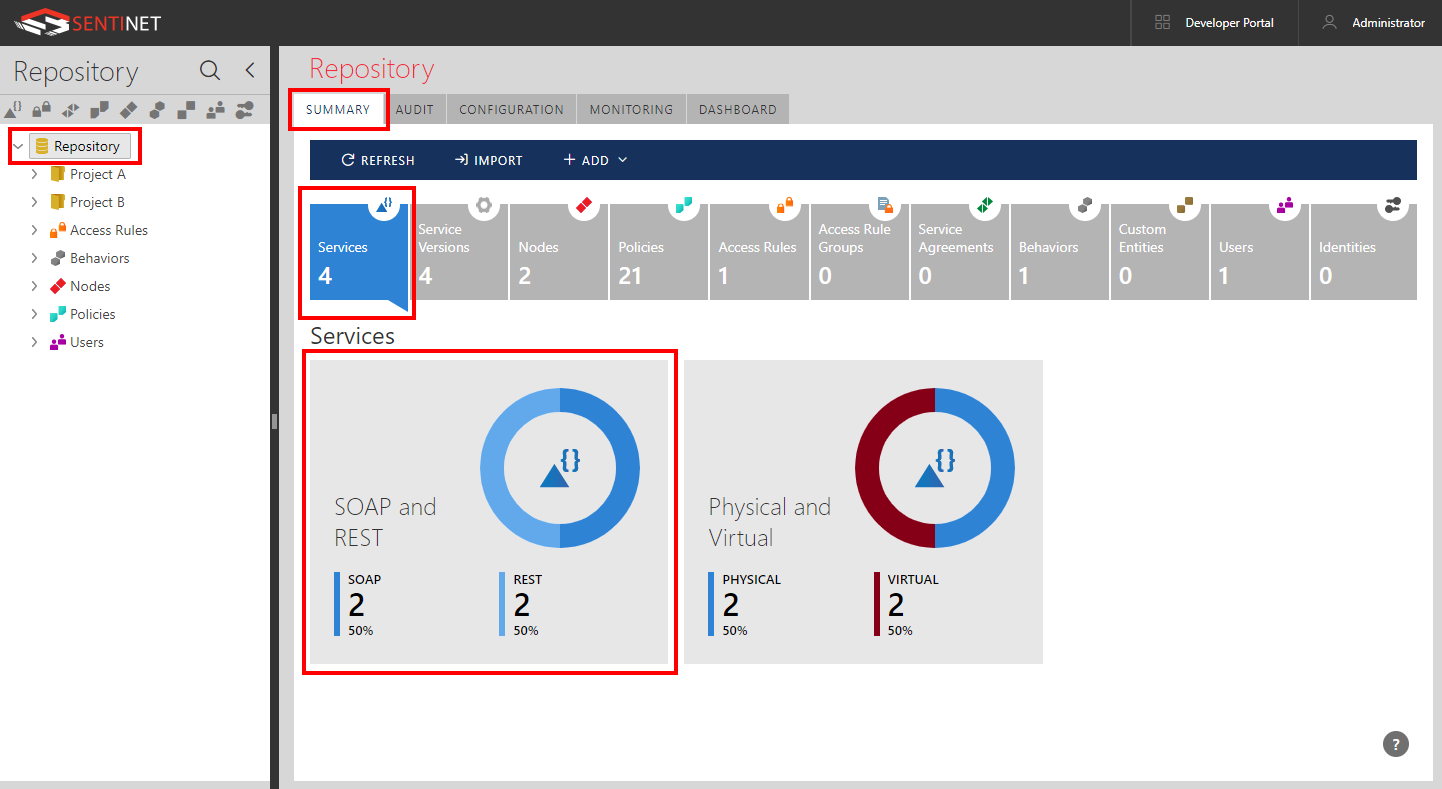
The following Repository tree items show Statistical Reports when their SUMMARY tab is selected:
Repository root item
Folder item
Access Rules group item
Policies group item
Nodes group item
Service Agreements group item
Behaviors group item
Physical Services group item
Virtual Services group item
Custom Entities group item
Users group item
Identities group item
Note: Users group item shows statistical report in a form of a list of all User Roles along with the count of users in each role. Users in a specific User Role can be further searched for using generic Repository search function.