Monitoring Chart
Monitoring is available through real-time charts for the last 5, 15 or 30 minutes, 1 hour or 24 hours.
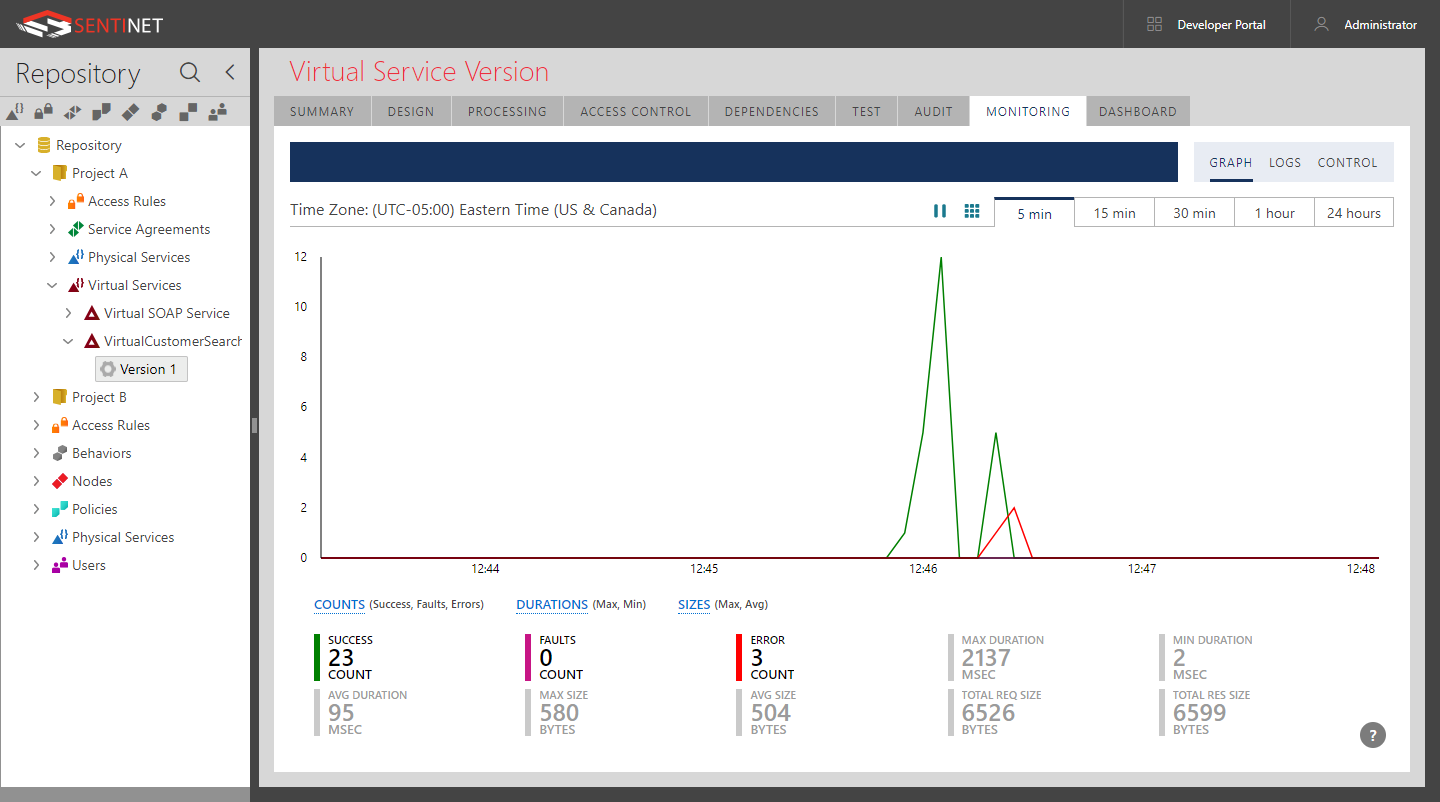
At any given moment, a real-time chart provides the total summary for the observable period. Different measurements can be displayed side-by-side on the chart. There can be up to two independent vertical axes placed on the chart, making it easier to analyze and compare data of different scales.
The real-time chart is automatically updated with the frequency equal to the time length between two adjacent time tick marks (for example: 5 seconds on a 5-minute chart, or 20 minutes on a 24-hour chart). An interactive tooltip shows the summary of collected measurements for the period the tooltip is covering.
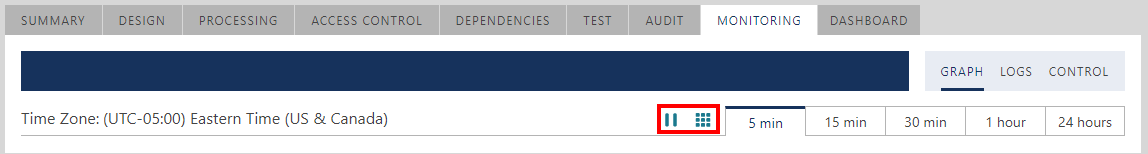
Click the Pause button to pause (and later resume) real-time chart auto-update.
Click the Grid button to show or hide grid lines.