Sentinet Monitoring
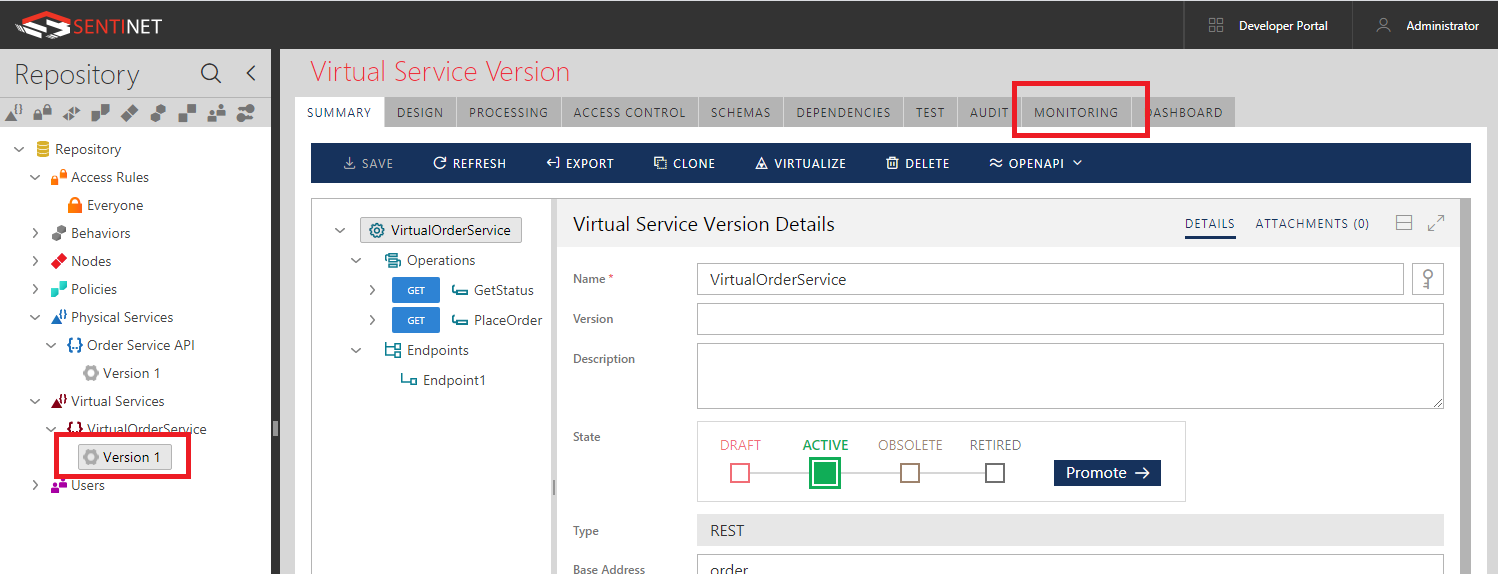
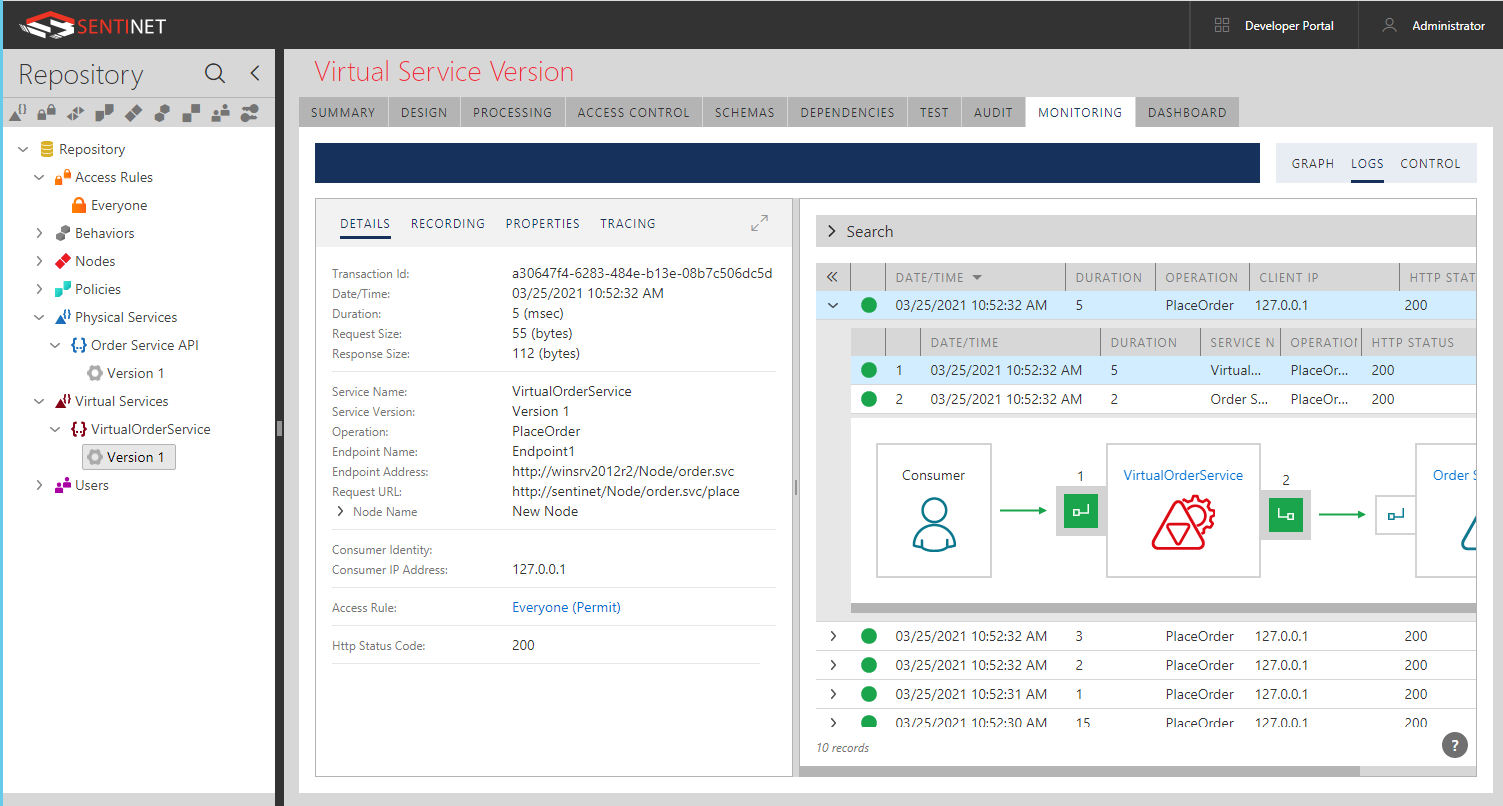
Go back to the Sentinet Administrative console. Select Version 1 of the VirtualOrderService in the Repository tree and click the MONITORING tab.
Real-time monitoring data at last 5 min intervals will be displayed. Review different summary metrics by clicking links for different metrics (COUNTS, DURATIONS, SIZES) or by clicking on grayed out metric card. You can also click tabs for different time intervals, such as 15 min, 30 min, 1 hour and 24 hours.
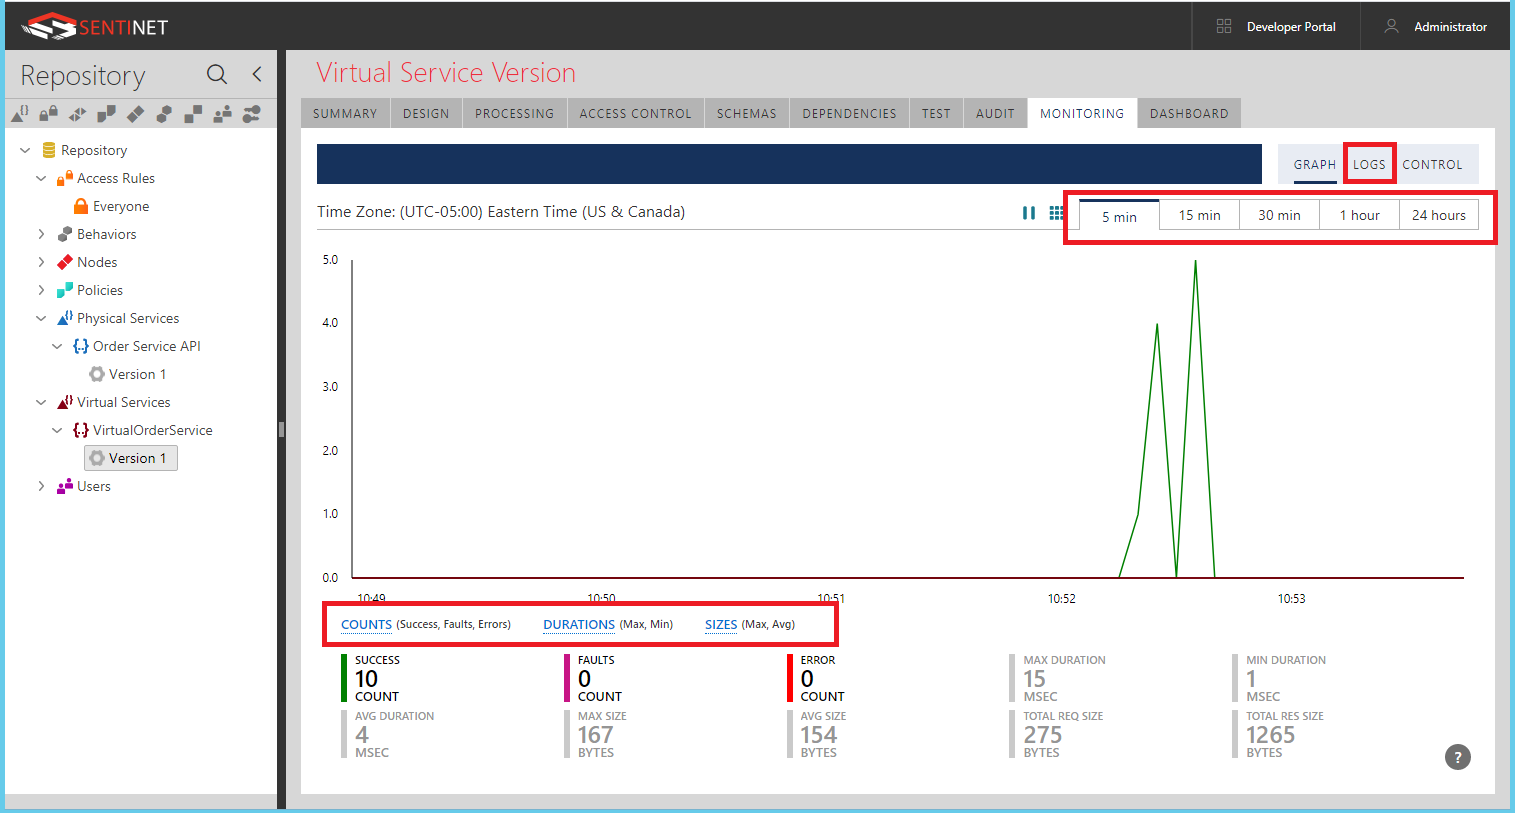
Click the LOGS sub-tab highlighted above to review individual transactions captured during the current time interval selected on the graph.
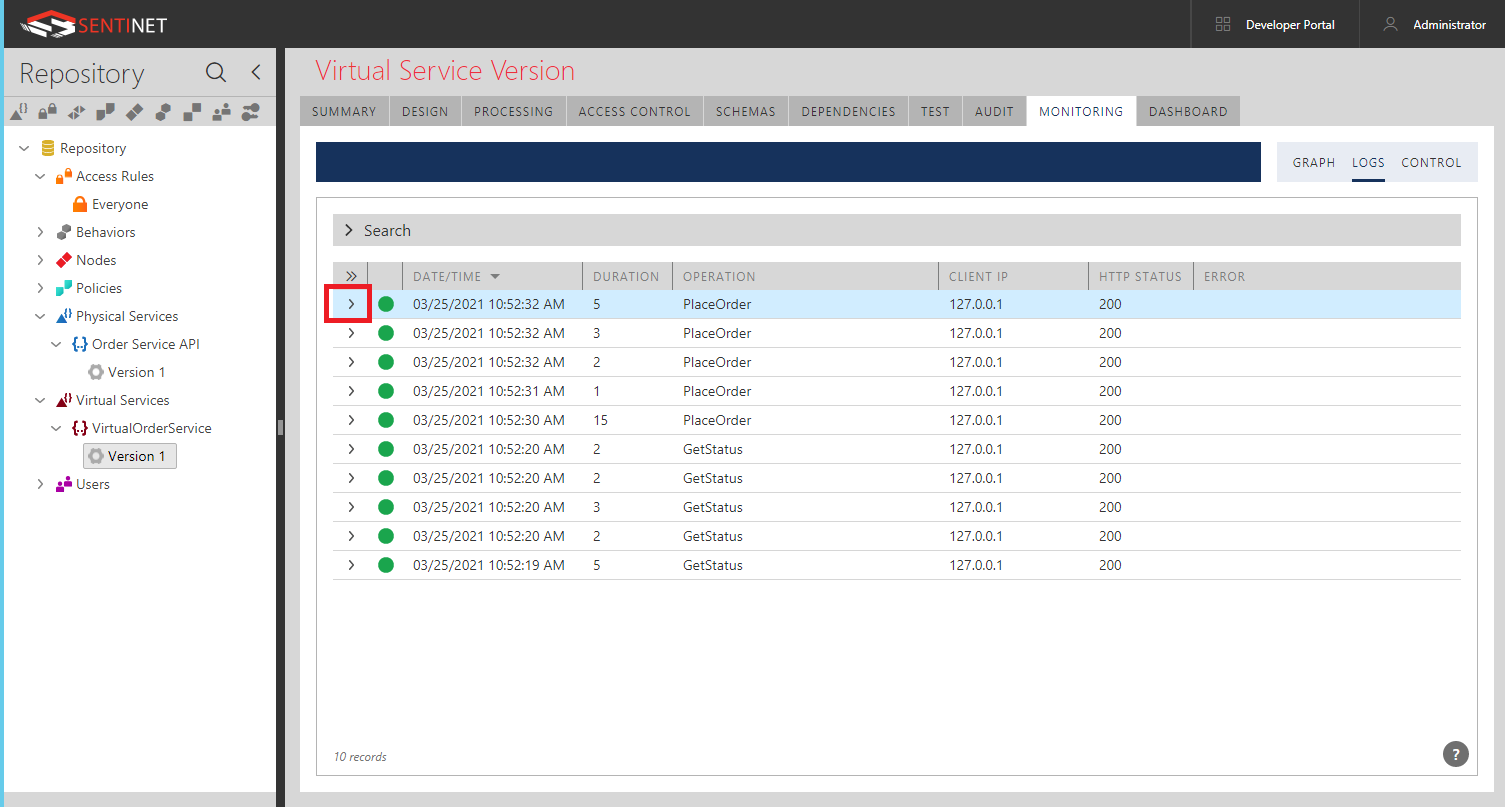
A list of transactions that occurred during the time interval observed by the graph will be displayed (you can also expand the Search panel to search for transactions at a specified time interval). Click the [>] located next to each transaction to expand a selected transaction.
A detailed view of how the transaction was transmitted from the client application to the physical Order Service API through the VirtualOrderService is shown. Note two transaction segments, marked as 1 and 2 represent messages sent from the client application to the virtual service, and then from the virtual service to the physical service.
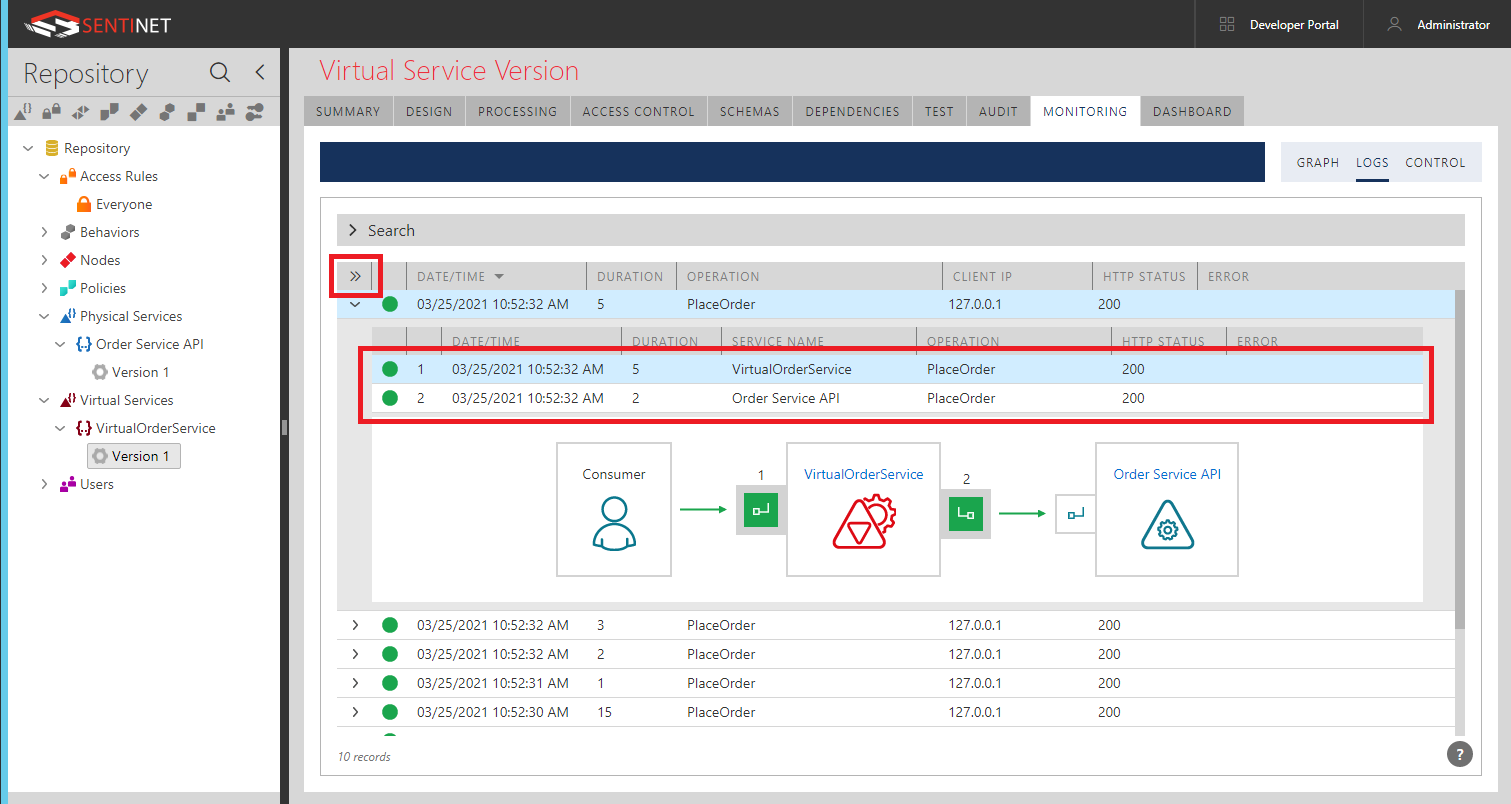
Double-click on the selected transaction or transaction segment. You can also click >> button for the same action, which is highlighted on the screenshot above. Transaction segment Details will now be displayed on the left side.
Click the RECORDING sub-tab.
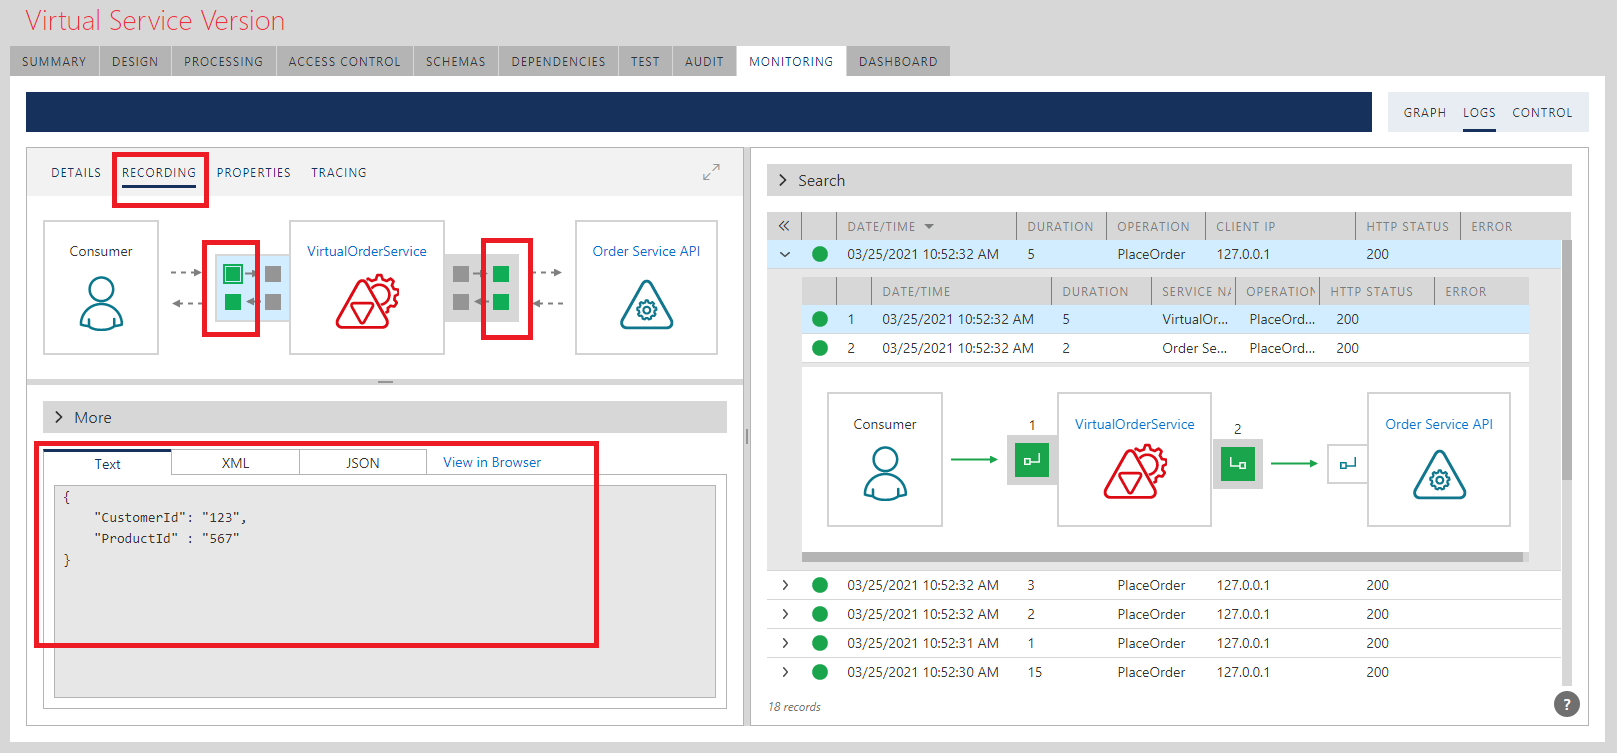
Green rectangles on the diagram above represent different recording points, where messages were instructed to be recorded. Click on each green rectangle (recording point) to update the bottom part of the screen with the content of message recorded at the selected recording point.