Monitoring
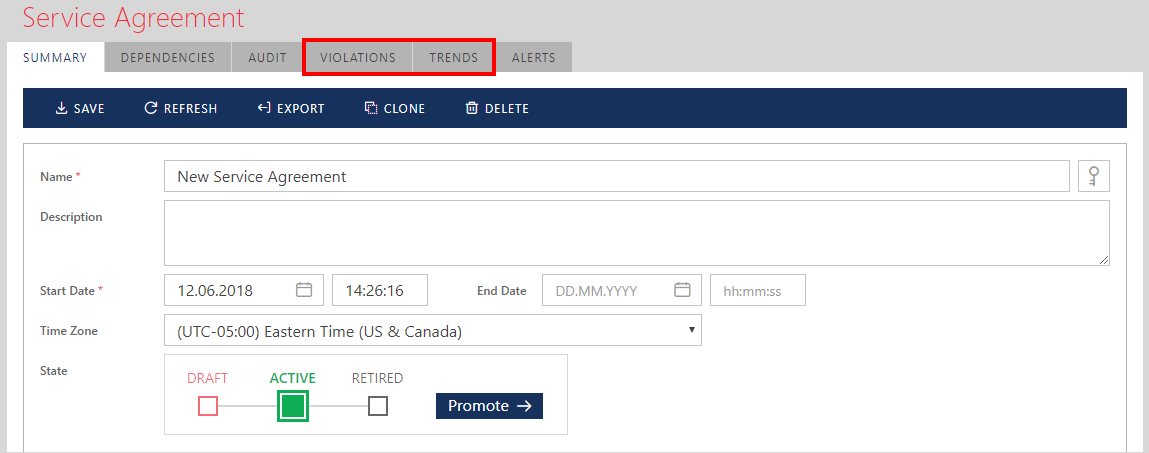
There are two types of Service Agreements monitoring, Violations and Trends. VIOLATIONS tab shows real-time charts and tabular logs of SLA violations, while TRENDS tab shows the current values of the SLA metrics in relation to their thresholds and allows for future violations prediction and past violations history analysis.
Monitoring Violations
Real-time Charts
Click the VIOLATIONS tab to see the real-time graph with Service Agreement violations. The real-time graph can show violations within the last 5 min, 15 min, 30 min, 1 hour, and 24 hours. The graph is automatically updated as often as the length of the time interval between two adjacent time tick marks. For example, the 5-minute graph below is updated every 5 seconds (12 ticks between e.g. 10:31 and 10:32). Automatic updates can be stopped by clicking the Pause button and resumed by clicking the Run button.
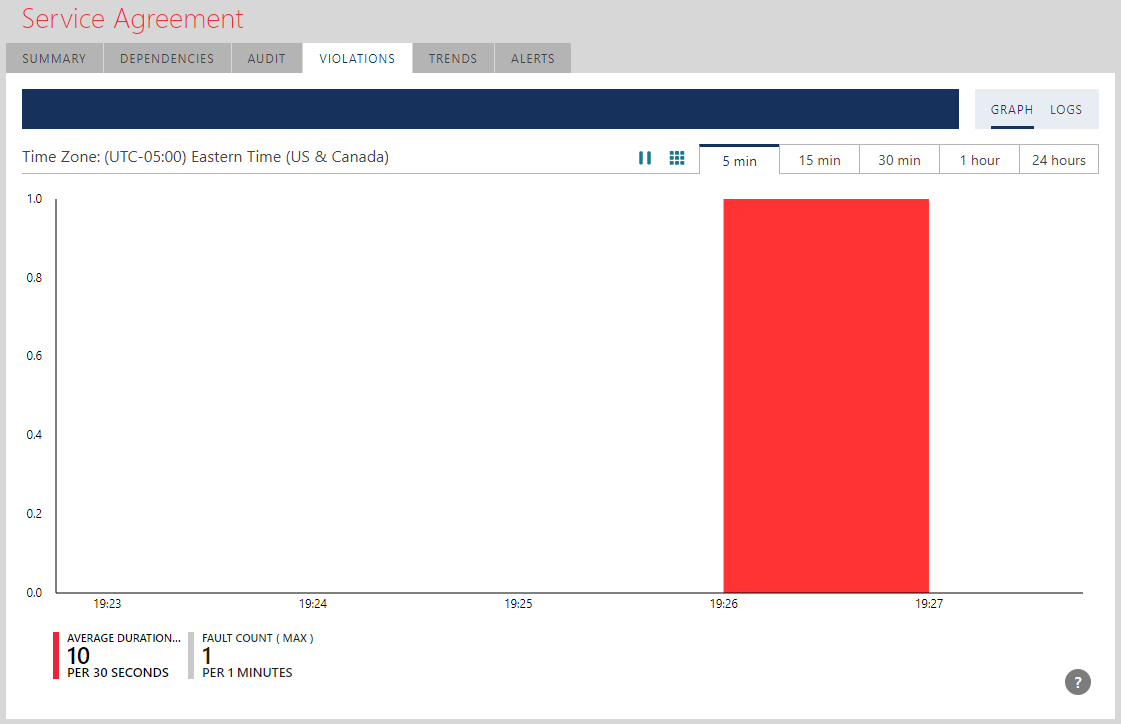
Real-time monitoring chart also shows a list of all the metrics that make up the Service Agreement. By checking metric cards at the bottom of the graph (for example 10 PER 30 SECONDS card on the figure above), a user can include (check) or exclude (uncheck) metrics from the violations graph to identify which metric(s) contributed to the SLA violation and how they contributed. A checked card shows in red color, the unchecked metric is grayed out.
An SLA violation is reported over the period that depends on the time duration of its metric and the observable aggregation time interval. For example, if a Failures Count metric is defined for 5 minutes, then:
Violations will be calculated at the end of each 5-minute interval (unless identified sooner).
Violations will be reported aggregated over the observable duration. For example, when an SLA is observed through the last 24-hours graph for the 5 minutes Failure Count, violations will be aggregated over 20-minute observable periods (each "tick" will show 20-minutes).
Violation Logs
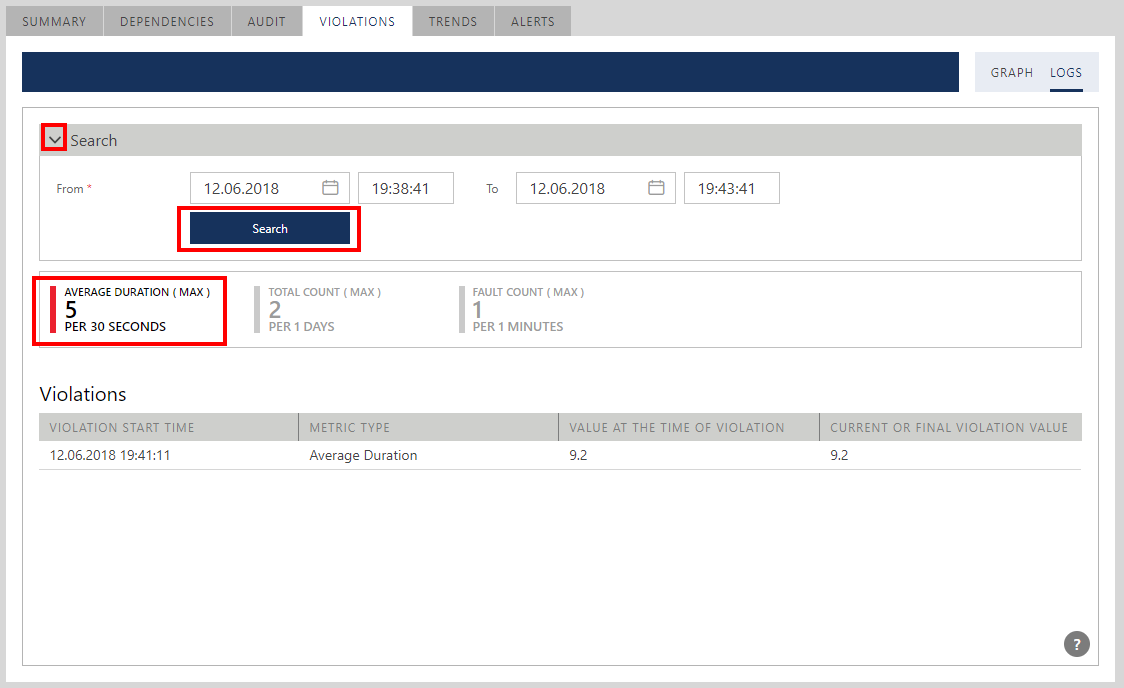
SLA violations can also be searched for and reported on for any period. Click LOGS tab to see the list of SLA violations for the period observed through the current real-time chart.
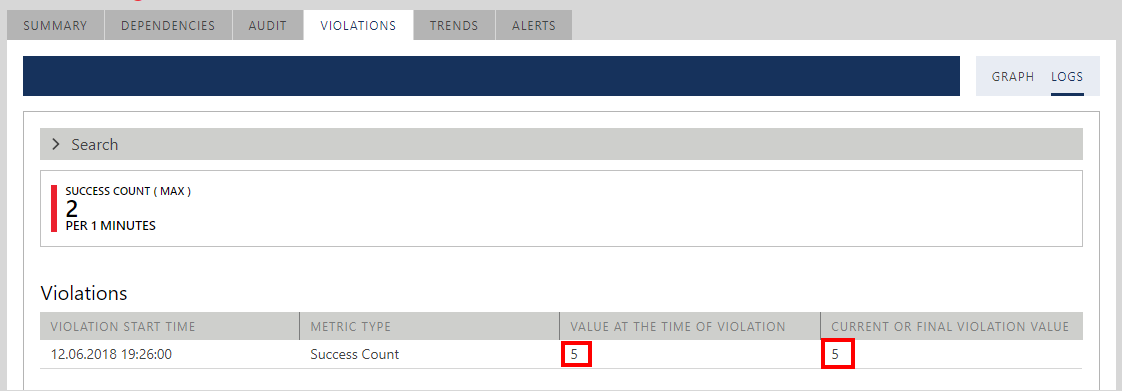
The log shows SLA details of each reported violation. Some violations may show different metric values at the time the violation was identified and at the end of the metric evaluation period (can be current time if evaluation period has not yet been reached). The screen above highlights Total Count metric violation that was defined for 1 minute with the maximum threshold value 2. At the time the violation was identified, Total Count was already at 5. At the time this log is generated (or by the end of the 1-minute interval), the metric value is still 5 but could have been even larger.
Expand Search panel by clicking on (>) symbol to search for violations for any period. Once Search panel and Search button are visible, Sentinet user can also filter SLA violations by specific metric by selecting/unselecting metric card(s).
Monitoring Trends
Real-time Charts
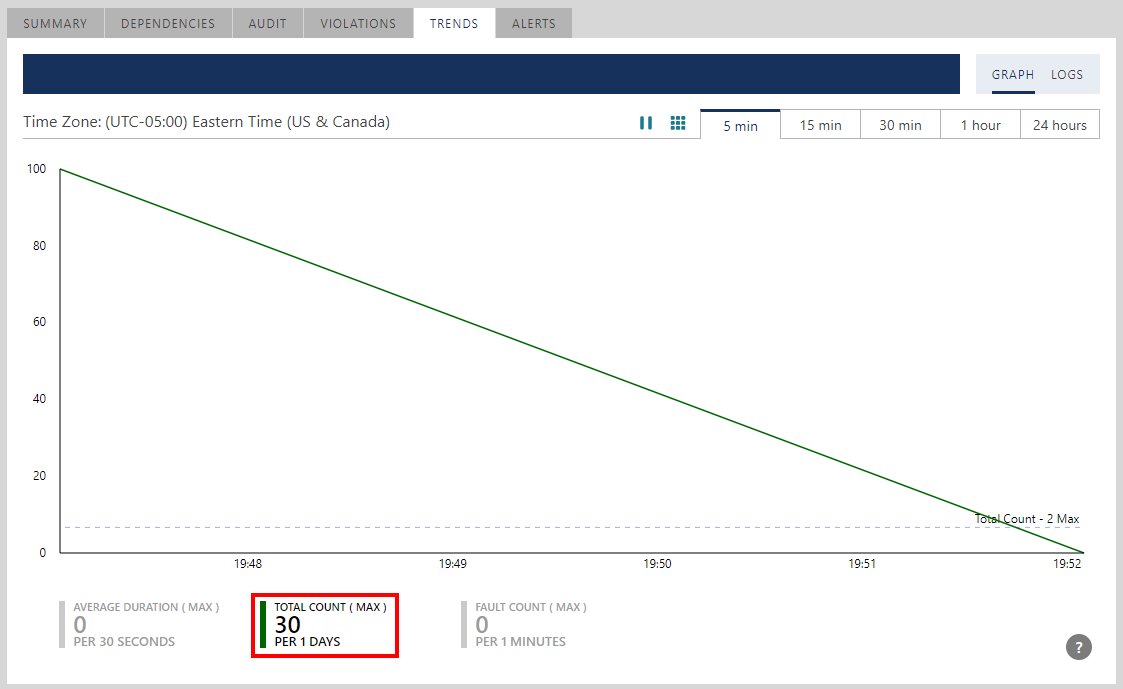
Click the TRENDS tab to see the real-time graph with Service Agreement trends. The graph shows metrics values collected at the metric evaluation time points. A dotted horizontal line shows the metric threshold. The metric graph line is shown in the standard metric color unless values exceed the threshold, then its measurement line is shown in red to indicate SLA violation(s). The scale of the vertical axis is always in 100% and corresponds to the maximum metric value during the observable time interval. In the example below, the figure shows violation trends for the Total Count metric defined for 1 day. 100% corresponds to the value 30 because it is the maximum value identified during the current 1-day period. The dashed line corresponds to the percentage of the threshold value 2 relative to the maximum value 30. By default, all metrics are shown on the graph. Sentinet user can filter them by selecting/unselecting metric card(s).
Metric Logs
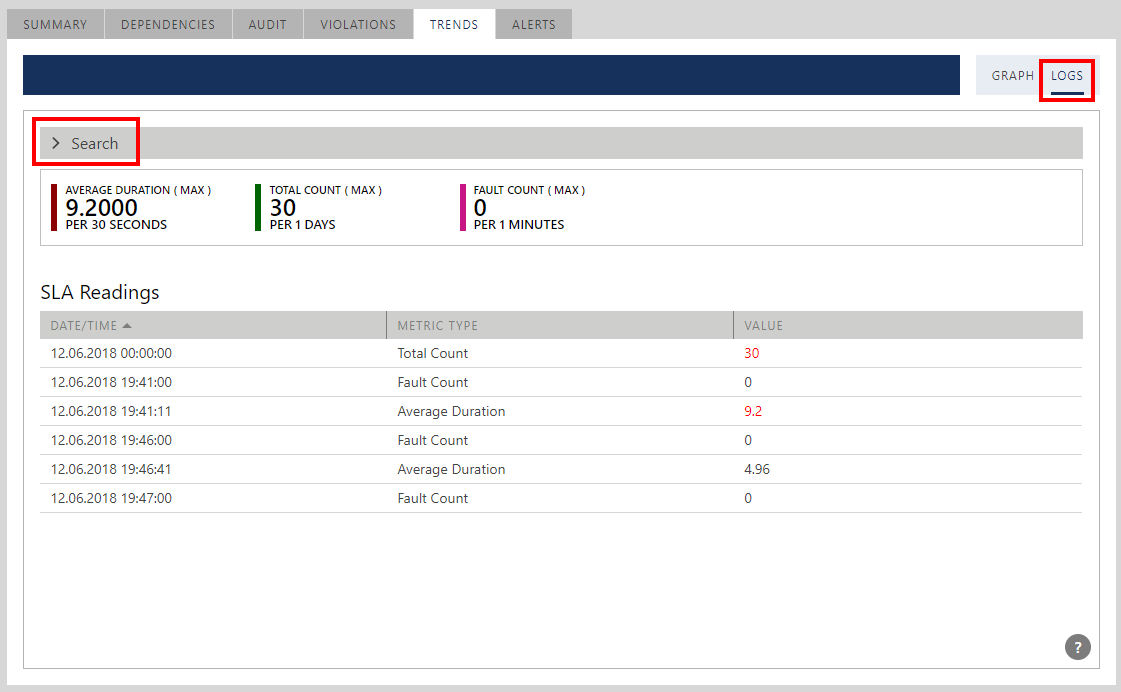
Click LOGS tab to see the list of SLA Readings (which are the metric values captured by Sentinet) during the observable period. Violation values will be shown in red. Logs can be filtered by specific metric(s) and searched historically by date and time.
Monitoring Violations for Multiple Service Agreements
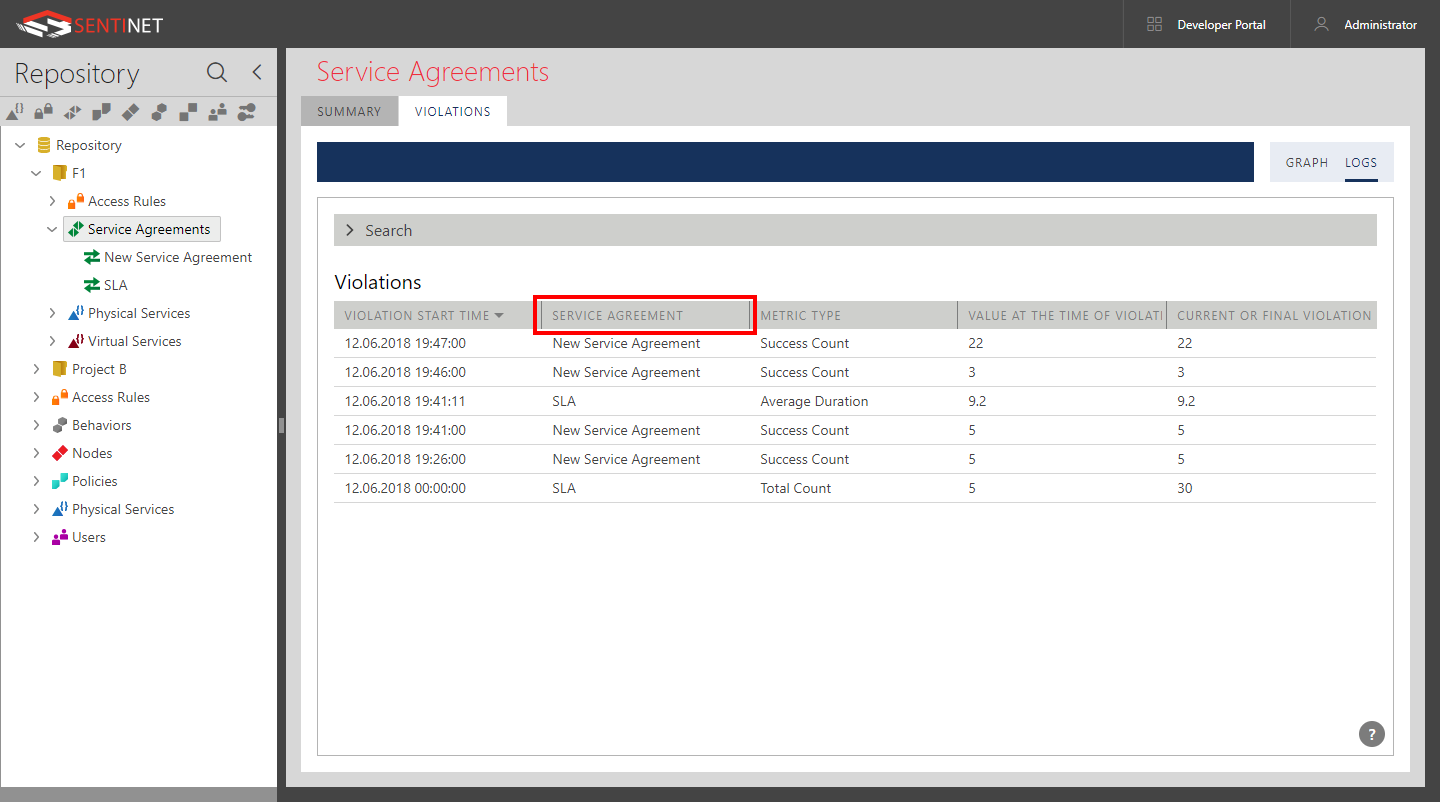
Violations of the multiple Service Agreements can be monitored and reported off a single screen when created as immediate children of a specific Repository Folder. Select Service Agreements Repository tree item and its VIOLATIONS tab.
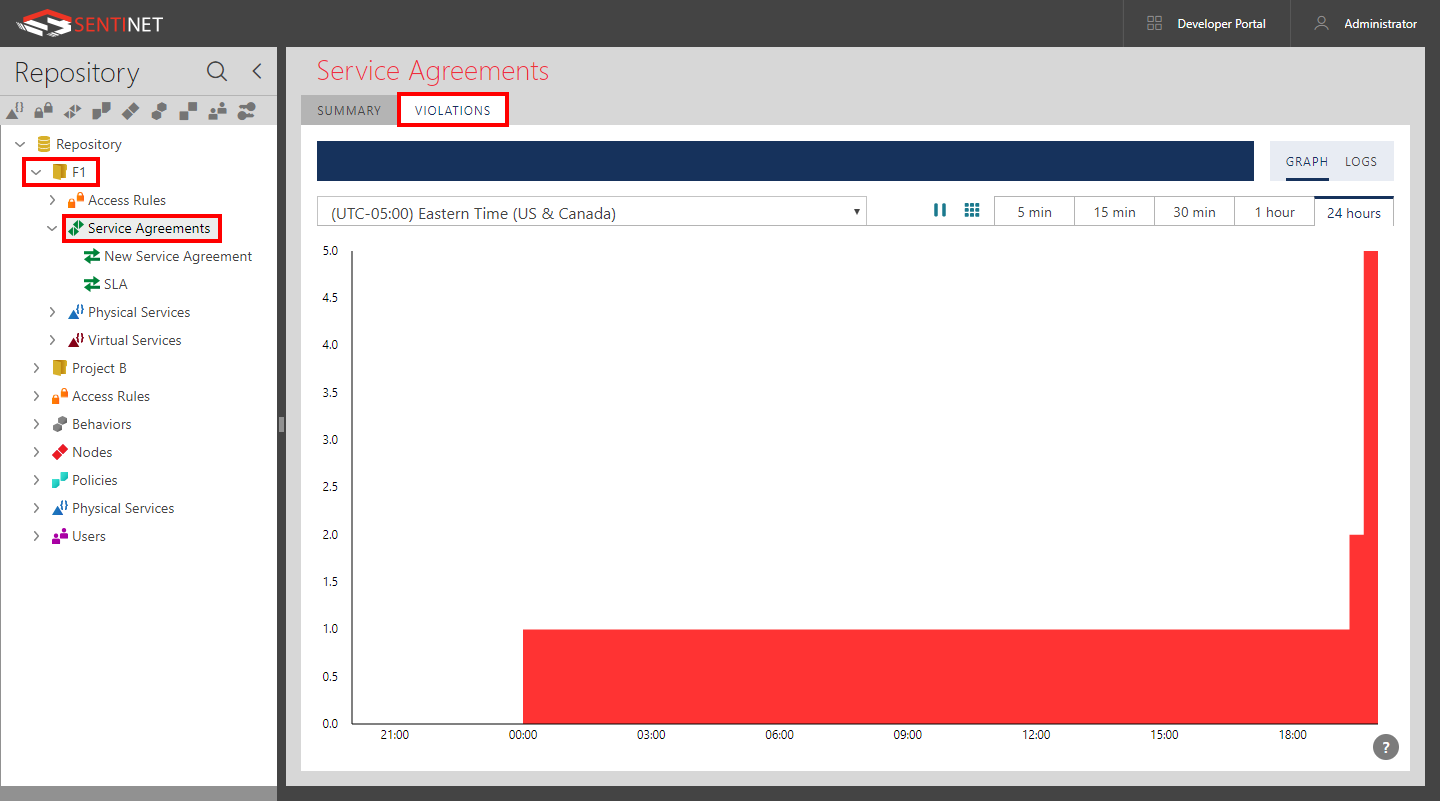
SLA violations logs can also be reported on for all SLAs located in the current Repository Folder.
