Monitoring Logs
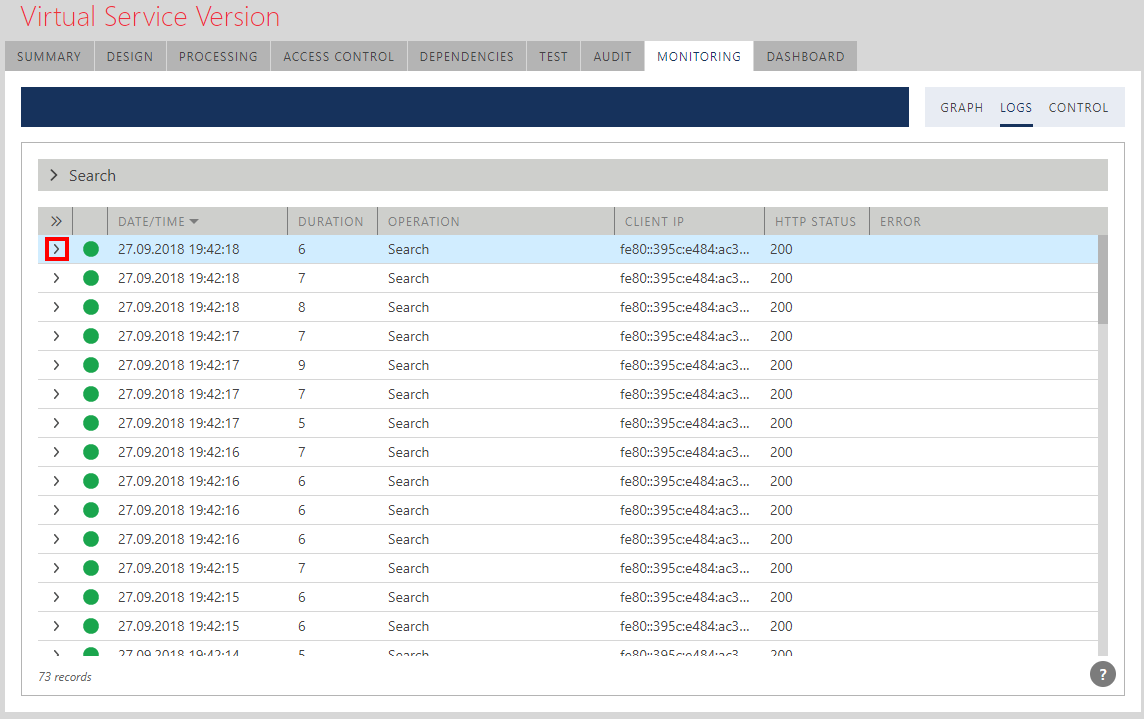
Service monitoring provides access to the logs of individual transactions. To review all transactions displayed in the current running (or paused) real-time chart, click the LOGS tab.

Sentinet users can also double-click the mouse button in the graph area to select only those transactions that are shown behind the graph's tooltip.
Basic transaction properties and statuses will be shown in the data grid. Transactions list is limited to the first 1000 transactions. Narrow search criteria to see transactions that may be outside the 1000 records limit (see Transactions Search chapter for more details on advanced Search criteria available in Sentinet). Transactions list can be sorted by any column available in the list.

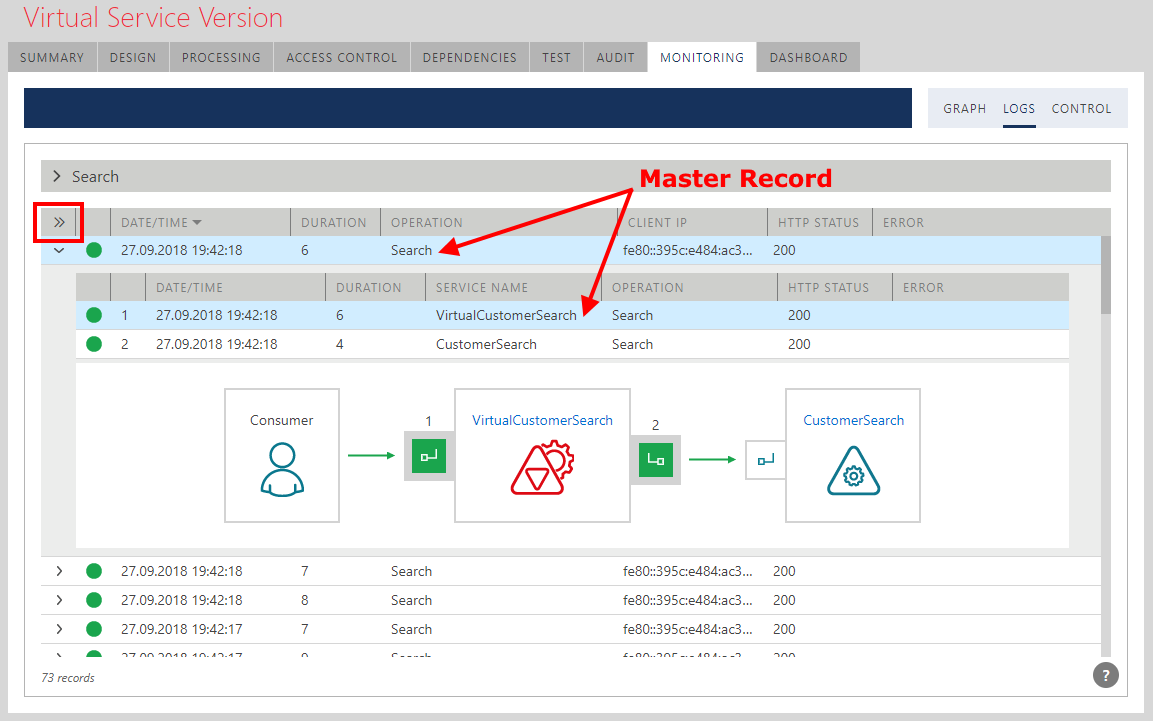
Click the ">" button (or double-click selected grid's row) to expand selection and track transactions through a virtual service via a tracking diagram. Each transaction may consist of up to two segments, an inbound segment and an outbound segment. An outbound segment may not be available if the virtual service generated a SOAP Fault on its own (for example an "Access Denied" SOAP Fault) and did not make any attempt to call business service. Each numbered segment is color-coded green for success, red for error and magenta for application faults generated by the business services. The tracking diagram will show tooltips with endpoint names and addresses when users hover over a segment number with the mouse.

A master record (that is expanded with the Tracking diagram) will match the transaction segment relevant to the monitored service type. For virtual service monitoring, a master record will be the first transaction segment, but for physical service monitoring, a master record will be the segment that corresponds to the last segment of the transaction.
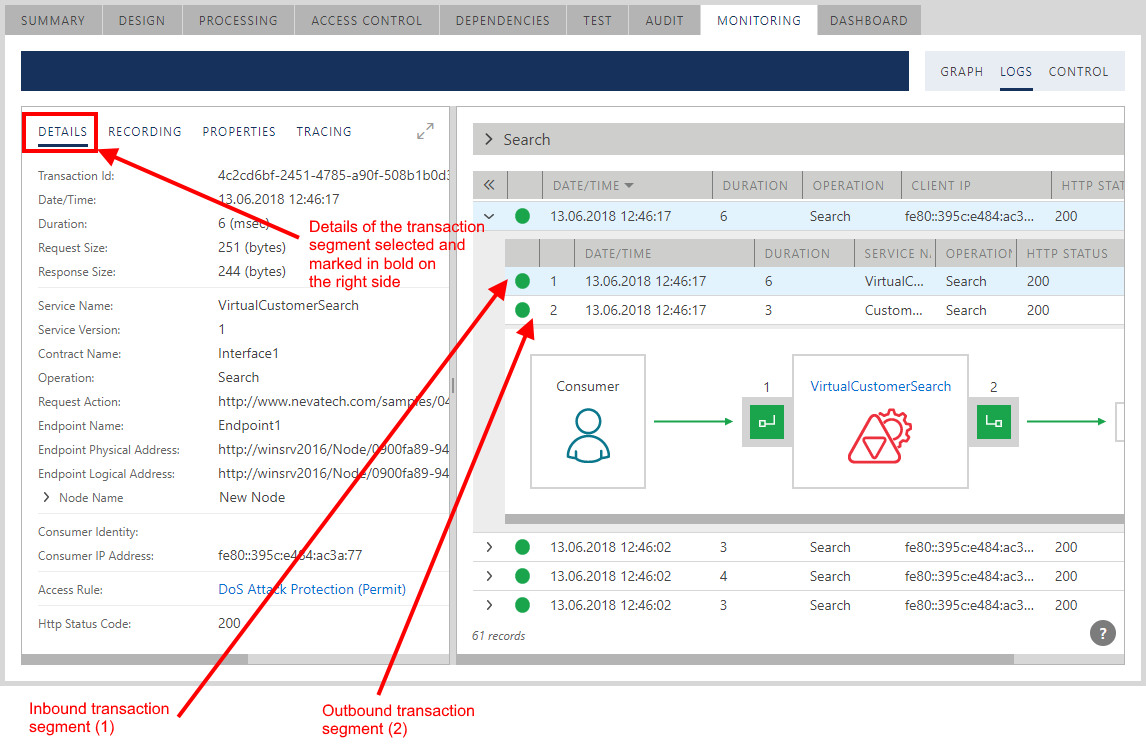
Double-click a master record or a transaction segment record (you can also click ">>" button). The data grid will slide away to the right, revealing details of the transaction segment. Details of the virtual service's inbound segment marked as 1 will be shown in the left pane.

Select outbound segment in the child grid (marked as 2 in the child grid and on the diagram) to see details of the outbound part of the transactions in the left pane of this screen.
The RECORDING tab of the transaction details view shows the full content of the recorded messages’ body content. By default, no message recording is performed. See Recording chapter for more details on how to control recording options.

The PROPERTIES tab of the transaction details view shows the list of custom Monitoring Properties and their recorded values (see Monitoring Properties chapter for more details).

The TRACING tab of the transaction details view, shows available traces of the Sentinet Access Rule engine execution, Pipeline execution and OAuth handshakes (see Tracing chapter for more details on how to control tracing).

Transaction Duration
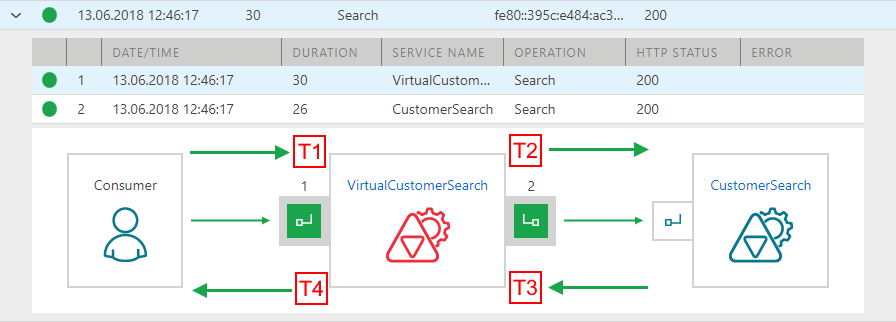
Sentinet measures transaction duration based on the time stamps recorded during message processing inside the Sentinet Node. The figure below provides a visual explanation of where Sentinet captures messages with time stamps for the purpose of calculating durations. There are 4 time points designated as T1, T2, T3 and T4 on the diagram below.

Sentinet makes a note of the timestamp as soon as it receives the inbound request message, time stamp T1. Then it makes a note of the timestamp as soon as it is ready to send the request message on its outbound side, time stamp T2. Next Sentinet makes a note of the timestamp as soon as outbound response is received from the business service, time stamp T3. Finally, it makes a note of the time stamp as soon as the inbound response is sent to the client application, time stamp T4.
T3 minus T2 (T3 - T2) is the duration of the outbound side of the transaction. On the diagram above, it was calculated as 26 milliseconds. This is effectively the time Sentinet noticed between sending the outbound request and receiving the outbound response back from the business service -- duration of the outbound segment of the transaction marked as segment 2. This time is often considered to be a reasonable measurement of the backend service's performance, but it also includes network traffic time of the outbound side and in some cases the time needed to establish the actual network connection with the business service.
T4 minus T1 (T4 - T1) is the duration of the transaction from the moment the inbound request was received to the moment the inbound response was sent. On the diagram above, it was calculated as 30 milliseconds and it is shown as the duration of the first segment of the transaction marked as 1. Note that the duration of the segment 1 also includes the duration of the segment 2, so that 30 milliseconds spent on segment 1 also includes the 26 milliseconds spent on segment 2. As a result, you can see that Sentinet itself contributed only 30 - 26 = 4 milliseconds when message was inside the virtual service. T4 - T1 time difference does not include network traffic time between the client application and the Sentinet Node. Sentinet cannot possibly know how long it takes for the client to send its message and then to receive the response over the network.